


Use the following procedure to view alert details.
Note: See also
Exploring XDR Data on the Alerts Page.
Procedure
- To view the details of an alert, do one of the following:
- Double-click the alert.
- Click the
 icon to the right of the alert row.
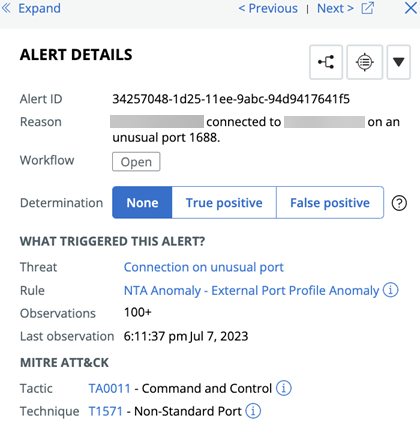
The expanded, right-side pane displays. An Alert Details summary pane describes the type of alert, the alert ID, the reason for the alert, the policy and rule name, and the workflow status. - Click
 to view the Alert Details pane in a separate tab and to open further panes.
The expanded view displays the following panes:
to view the Alert Details pane in a separate tab and to open further panes.
The expanded view displays the following panes:- Alert Details
- Report
- Parent Process
- Child Process
- Process
- Remediation
- Asset
- Alert ID History
- Threat ID History
- You can:
- Click <Previous or >Next to view the alert details of the previous or subsequent alert.
- Use the respective buttons in the upper-right corner of the Alert Details section to further triage or investigate the alert.
- View the causes of the alert in the What triggered this alert? section. If the number of observations displays 100+, you can:
- Click the Alert triage icon
 to view 100 observations.
 - Click the Investigate icon
 to view all the data beyond the 100 observations.
- Click the Alert triage icon
- Export alert details to a PDF format.
Use the Export button in the upper-right corner of the Alert Details section. After 5-10 seconds, the PDF displays in your browser downloads.
- The file name format is Alert_Report_{alert_id}_{date}.pdf.
- The PDF contains a page break between each alert details section.
- You can only export a single alert at one time.
- Click the down-arrow
 icon to view additional actions you can take.
Note: If the alert was generated by a Core Prevention policy, you will have the option to create a Core Prevention policy exception in the Remediation pane. See Add a Core Prevention Process Exclusion from the Alerts Page.
