Aggregate data can help identify improvements in your SOC workflows. Are their known-good processes driving false positive alert volume? Can existing Watchlist Reports be tuned for greater efficacy? What type of alerts should new SOAR playbooks focus on?
Required Product: Any
Required Data: Alerts (App Input or Data Forwarder)
Some of these visualizations are already built into the Carbon Black Cloud Splunk SIEM app’s Alerts Overview dashboard, but these queries can help your SOC to more easily customize what’s important to you.
The data is available from both the data model and the indexed data. The data model queries should execute much faster, especially if you are looking for 7+ day trends in large environments. However, as those are less intuitive to edit, your team might choose to work from the indexed data queries for customizations.
Alerts over Time by Type
Indexed Data
eventtype="vmware_cbc_alerts"
| timechart span=1d dc(id) by type
Data Model

Alerts over Time by Severity
Indexed Data
eventtype="vmware_cbc_alerts"
| timechart span=1d dc(id) by severity
Data Model

Alerted Devices over Time
Indexed Data
eventtype="vmware_cbc_alerts"
| timechart span=1d dc(device_id) by type
Data Model

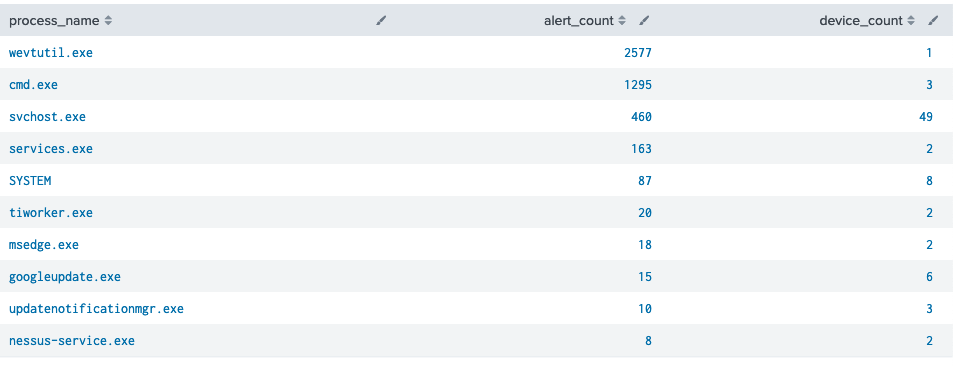
Top Alerted Processes
Indexed Data
| stats
  dc(id) as alert_count,
  dc(device_id) as device_count
  by process_name
| sort -alert_count
| head 10
Data Model

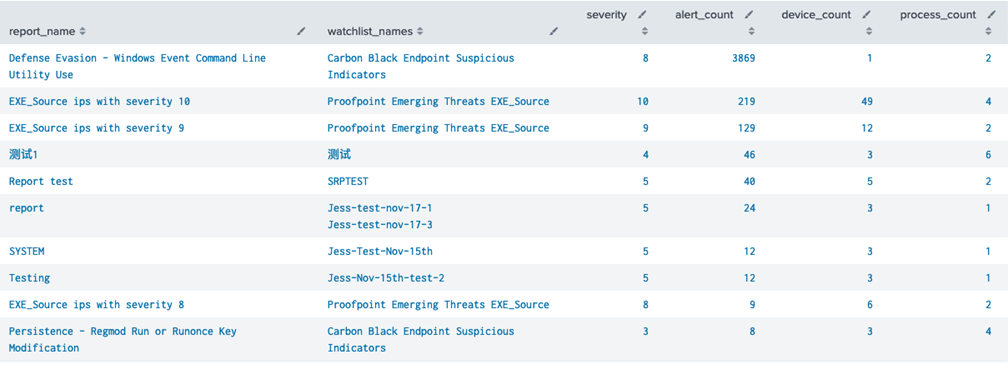
Top Watchlists and Reports
Required Product: Carbon Black Cloud Enterprise EDR
Indexed Data
eventtype="vmware_cbc_watchlist"
| stats
  values(watchlists{}.name) as watchlist_names,
  max(severity) as severity,
  dc(id) as alert_count,
  dc(device_id) as device_count,
  dc(process_name) as process_count,
  by report_name
| sort -alert_count
| head 10
Data Model

Blocked Malware
Required Product: Carbon Black Cloud Endpoint Standard
Indexed Data
eventtype="vmware_cbc_cb_analytics"
blocked_threat_category IN ("KNOWN_MALWARE", "NEW_MALWARE")
| stats
  dc(id) as alert_count,
  dc(device_id) as device_count,
  values(device_name) as device_names,
  values(sensor_action) as sensor_actions
  by process_name
| sort -alert_count
Data Model
