


This topic describes the Sensor Details page Summary panel.
The Summary panel displays the following information about the sensor’s health and activity:
Item |
Description |
|---|---|
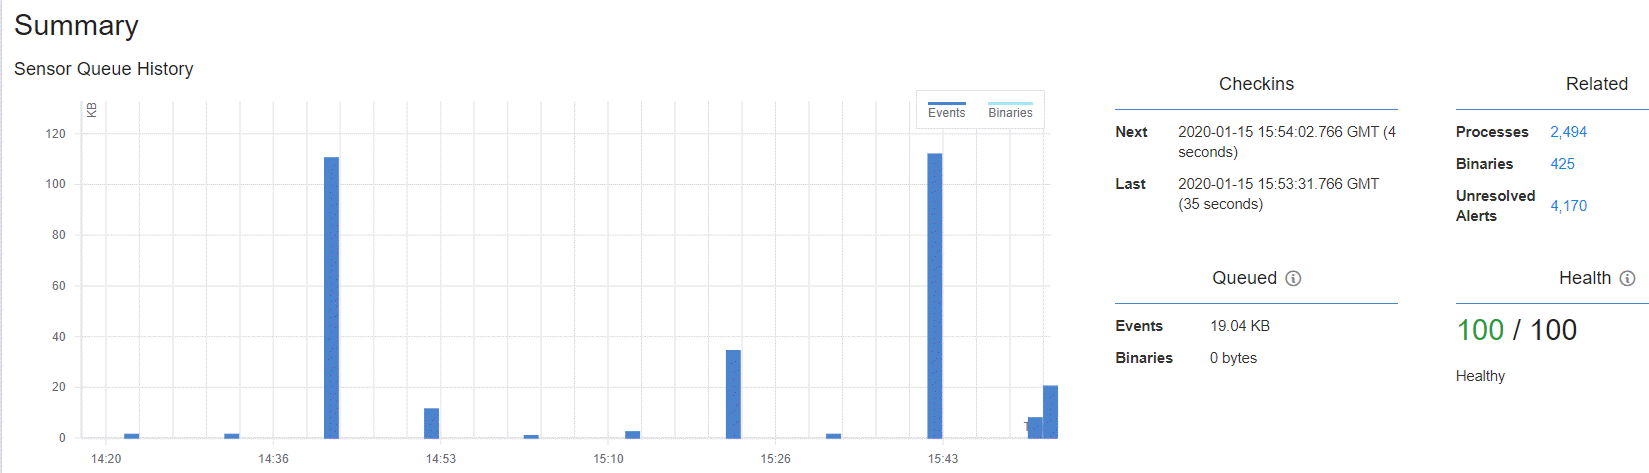
Sensor Queue History |
A graph that displays the recent history of activity in the sensor’s queue. Click View Details to view this data in tabular form. |
Checkins |
Shows the Next and Last times (GMT) that the sensor checked in with the Carbon Black EDR server. |
Related |
Processes, binaries, and alerts that are associated with the host. |
Queued |
Events and binaries that the sensor has not yet sent to the Carbon Black EDR server. The maximum queue size can be managed in Sensor Group Settings. |
Health |
Sensor health score, and a health message from the sensor if there is one. See Sensor Health Score Messages. |
