You can view alert activity on the Head-Up Display (HUD) page.
The HUD page is a customizable page that provides a summary of alerts on hosts that report to your Carbon Black EDR server. See Head-Up Display Page.

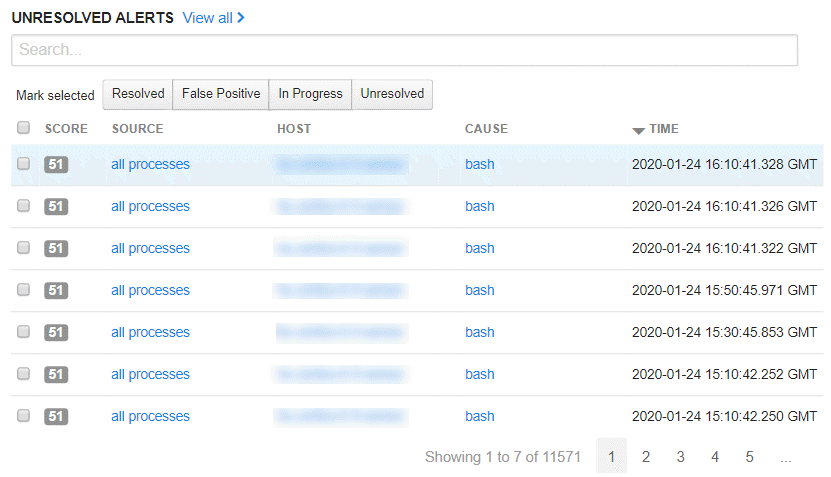
By default, the Unresolved Alerts panel displays all unresolved alerts for a sensor. You can also display resolved, false positive, and in- progress alerts by clicking a button at the top of the Unresolved Alerts panel:
-
Resolved
-
False Positive
-
In Progress
-
Unresolved
The Unresolved Alerts panel contains the following columns:
Some columns in this panel are sortable, such as the Score and Time columns. You can determine if columns are sortable by hovering your cursor over the column name; sortable column names will turn black and your cursor will change to a hand icon. An arrow appears, indicating the sort direction (ascending/descending).
| Pane |
Description |
|---|---|
| Score |
Displays the alert severity, where 100 is a severe threat and 1 is not a threat. |
| Source |
Displays the feed that is associated with the alert, such as threat intelligence and watchlist feeds. Clicking a link in this column opens the associated page. |
| Host |
Displays the host that is associated with the alert. Clicking a link in this column opens the Sensors page. |
| Cause |
When the alert is caused by a binary, this column displays the binary’s MD5 hash. Clicking on this link takes you to the Binary Search page. See Binary Search and Analysis. When the alert is caused by a process, this column displays the process name. Clicking on this link takes you to the Process Search page. See Process Search and Analysis. |
| Time |
Displays the time when the alert occurred. |
The Unresolved Alerts panel also contains a View all link in the top-right corner. Clicking this link displays the Triage Alerts page.