This topic describes how to view this information in the Server Dashboard, and the details that display there.

The Server Dashboard provides an overview of the following sensor and server details:
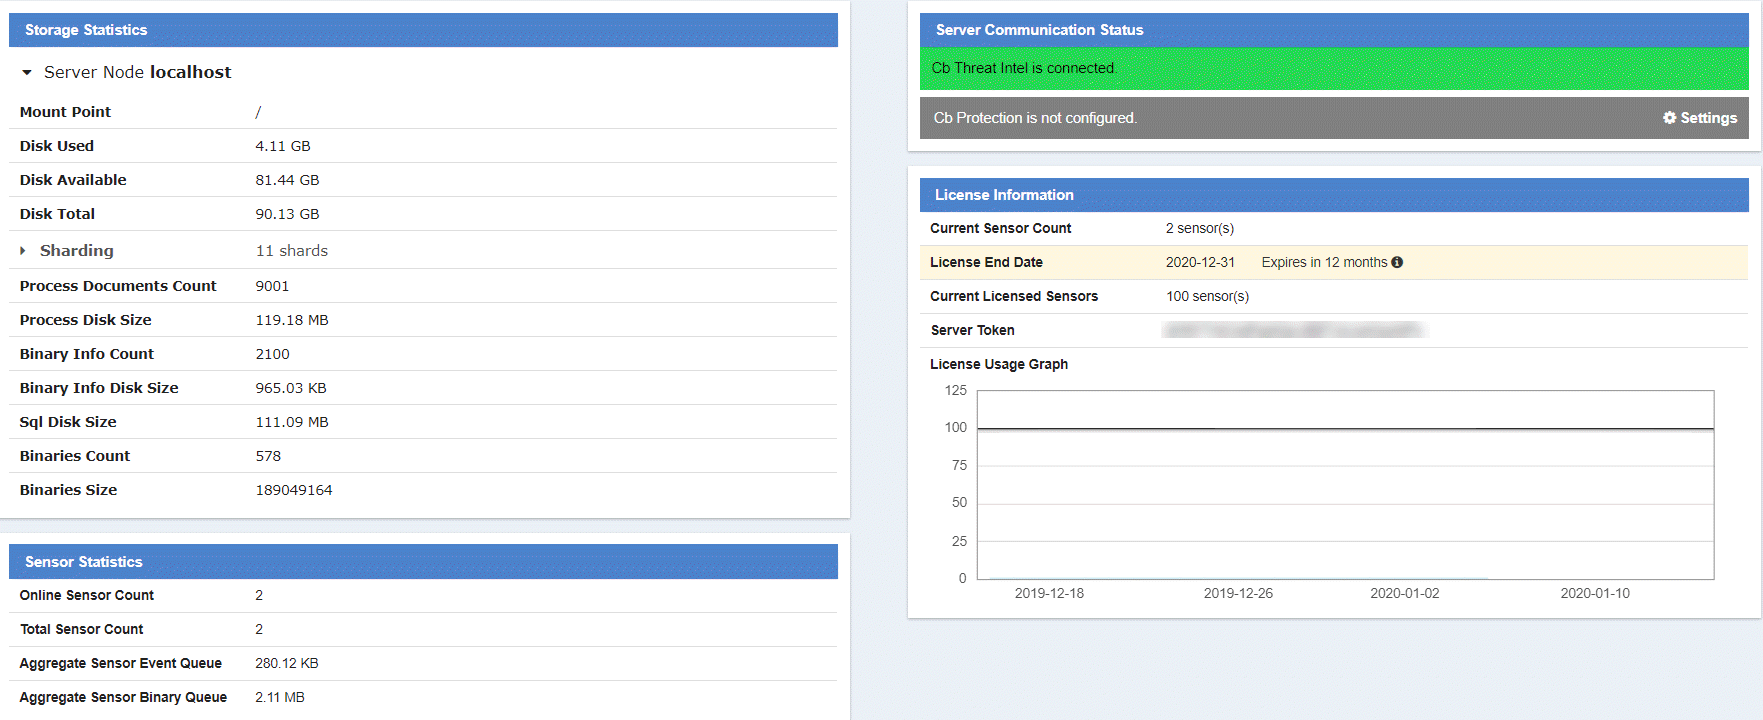
  • Sensor statistics

  • Server communication status

  • License information

Note:

The Server Dashboard is only available to Carbon Black EDR Global Administrators and Carbon Black Hosted EDR Administrators.

View Server and Sensor Information in the Server Dashboard

Perform the following procedure to view sensor and server information in the Server Dashboard.

Procedure

  1. On the navigation bar, click Server Dashboard.
    The server dashboard
  2. Review information in the Storage Statistic panel:

    Field

    Description

    Mount Point

    The mount point for the Carbon Black EDR server data directory.

    Disk Used

    The amount of the disk space used for storage.

    Disk Available

    The amount of the disk space still available for storage.

    Disk Total

    The total amount of disk space.

    Sharding

    The number of shards on the disk. Expand to see associated ID, size, document count, and max document count.

    Process Documents Count

    The number of process documents uploaded to the database on the server. This is the same number as the total number of processes on the Process Search page .

    Process Disk Size

    The disk space used by the process documents.

    Binary Info Count

    The number of binaries that are seen by the sensor. This is the same number as the total number of binaries on the Binary Search page .

    Binary Info Disk Size

    The total number of bytes of binary information that is uploaded to the server.

    Sql Disk Size

    The psql database disk utilization.

    Binaries Count

    The number of binaries stored on the server.

    Binaries Size

    The total number of bytes of binaries stored on the server.

  3. Review information in the Sensor Statistics panel:

    Field

    Description

    Online Sensor Count

    The number of sensors that are detected as being online by the server.

    Total Sensor Count

    The total number of sensors installed and registered for this server.

    Aggregate Sensor Event Queue

    The total size of queued events needing to be pushed to the server for all online sensors.

    Aggregate Sensor Binary Queue

    The total size of queued binaries needing to be pushed to the server for all online sensors.

  4. Review information in the Server Communication Status panel:

    Field

    Description

    Carbon Black Threat Intel is connected

    Shows whether or not communication between the Carbon Black EDR server and Carbon Black Threat Intel has been established.

    Carbon Black App Control is not configured

    Shows whether or not communication between the Carbon Black EDR server and a Carbon Black App Control server has been established.

  5. Review the information in the License Information panel:

    Field

    Description

    Current Sensor Count

    Total number of unique online sensors in the last 24 hours (active).

    License End Date

    The date when the license terminates.

    Current Licensed Sensors

    The total number of sensors on the current license.

    Server Token

    The token for the Carbon Black EDR server. This token is primarily used for support purposes.

    License Usage Graph

    A weekly depiction of how many sensors are active for the license.