The Event List describes every recorded event that occurred inside the selected time range from the timeline.
When you first enter the Process Analysis page by choosing a Process Search result row, the selected row corresponds with a particular segment of the process. This selection affects the starting position of the Event List.
For example, a process shown in the Process Search result row might have three segments: 8:00, 9:00, and 10:00. If you choose the middle segment, the first row of the Event List displays the first event of the 9:00 segment. The timeline displays an orange triangle icon indicating that starting point.
If you expand, shrink, or move the timeline window, the window snaps to the nearest time segment boundary, and the Event List automatically scrolls to the first event of that time segment. The timeline displays a purple triangle icon indicating where that event is inside the process.
When you expand the timeline window, you increase the total number of events to display in the Event List. A 10-second timeout is in effect; this timeout only applies to the filters and process metadata. The events list will always show the true amount of events. If all filters and metadata for this timeline are not retrieved within 10 seconds, a message displays that the data is incomplete; to rectify this, reduce the size of the timeline window.
When you select a node in the Process Tree, the chosen segment becomes the first segment of the displayed process in the Event List.
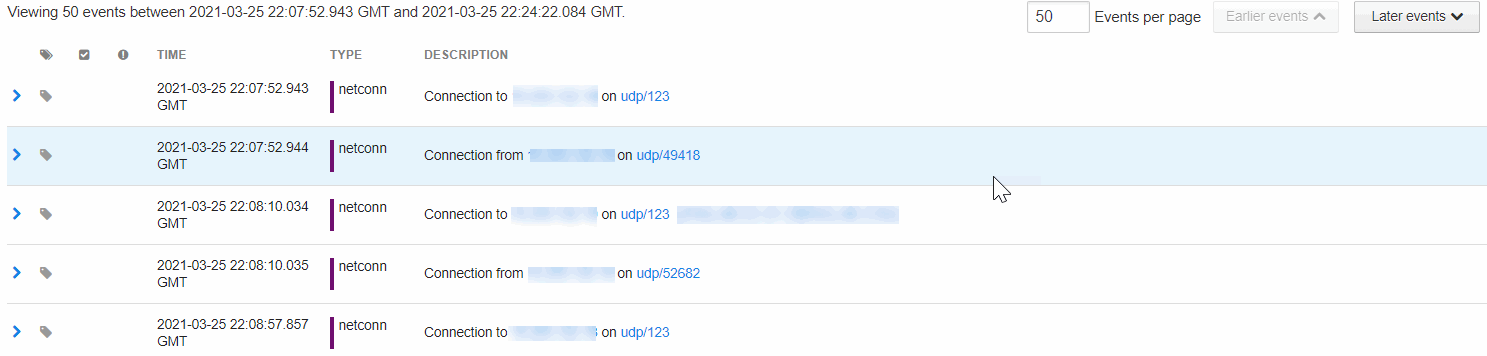
You can set the number of events to view per page, and define whether to view earlier or later events.
The Event List shows the following details:
| Heading |
Description |
|---|---|
| Expand event > |
Allows you to expand the event for additional data. |
| Tag |
Shows if an event is tagged for an investigation. You can click the tag icon to select this event for a future investigation. After you select the tag icon, it turns blue to indicate that it is now included in an investigation. |
| Trusted Events |
Shows if the event is trusted. When you click on the row, the trust information appears with a link to the source. |
| Threat Intelligence Feed Hits |
Shows if this event has matched a threat intelligence feed. |
| Time |
The time that the event occurred in Greenwich Mean Time (GMT). |
| Type |
The process event type. For more details, see Process Event Types.
|
| Description |
The operation that the Type event performed. See Process Event Types. The Description column can contain:
|
| Search |
Lets you reduce the number of events that display and focus the results based on terms entered into the Search box. For example, entering “Microsoft” into the Search box would display only Microsoft events. |


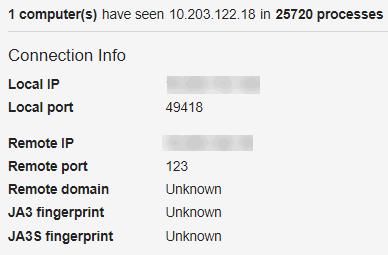
When you expand an event by clicking the > on the left side of the row, details about the event appear. This example shows details for an event of the type netconn: