


The VMware Cloud Flex Storage summary page shows important information about all datastores in the current storage region.
Region Summary
- System health. Overall health of all datastores in this region. Possible health statuses include:
Health Status Meaning Good
Datastore health is normal. Datastores are functioning properly.
Warning
Datastore health has some issue and needs attention. For example, when a datastore controller has gone offline, or if a datastore is getting low on unused capacity (<= 85%).
Critical A datastore is either not functioning normally or might stop functioning soon. Critical issues can include if a datastore is very low on unused capacity (<= 90%), if a datastore has not been sending data recently, or other internal processes are not functioning.
NA/Unmonitored VMware Cloud Flex Storage cannot determine the datastore health status. - Cloud storage. The amount of storage capacity currently being utilized by all datastores. The first number next to the icon is the number of datastores deployed, and the following larger number is the amount of logical used capacity.
- Clusters. Number of clusters that datastores are mounted to.
Datastores
- Datastores. Each datastore panel displays the datastore name, availability zone where you deployed the datastore, the names of mounted clusters and their SDDC, and indicates if there is a datastore mount failure. Operations you can perform from the datastore details panel from the Actions menu: open the datastore in VMware Cloud on AWS, mount or unmount a cluster, remount a cluster, and delete a datastore. Clicking View Details opens a new page with more information about the datastore, mount or unmount a cluster, remount a cluster, and delete a datastore.
- Used. The amount of data being consumed, which is the total sum of actual data stored on all datastores in the region. It does not refer to provisioned storage or available storage remaining.
Note: In vCenter, NFS capacity metrics do not reflect VMware Cloud Flex Storage billed usage, and might show a different number.
Datastores List
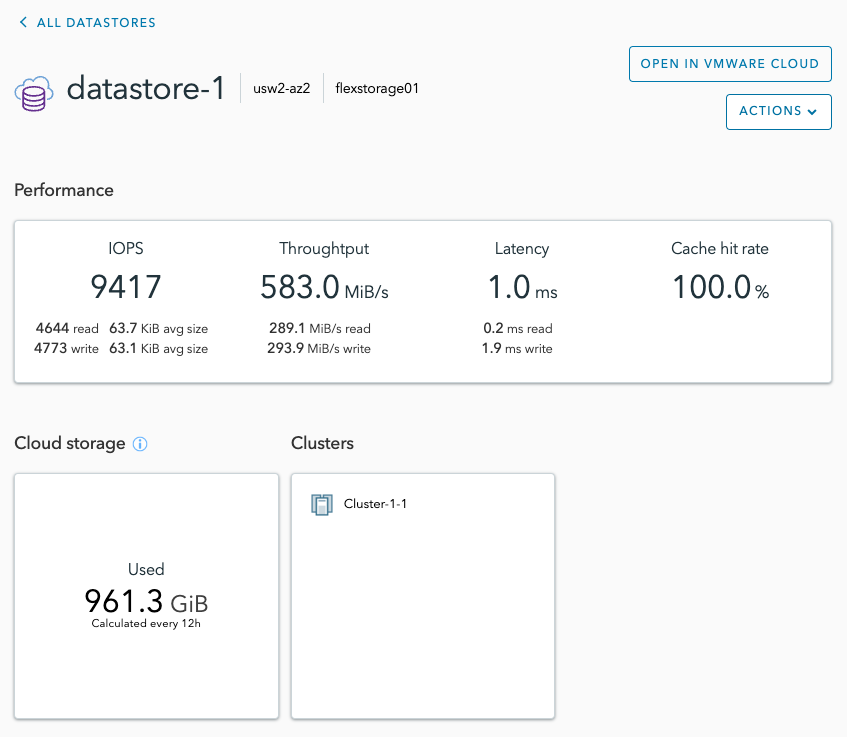
Datastore Performance Details
| Datastore Information | Description |
|---|---|
| IOPS |
Input/Output Operations Per Second (IOPS) measures the number of read and write commands a storage device or medium completes every second for all workloads on the datastore. IOPS also indicates the average KiB size for each read or write operation, measured in Kibibytes (KiB), where 1 KiB = 1024 bytes. |
| Throughput |
The data transfer rate to and from a datastore, measured in mebibytes (MiB), where 1 MiB = 1024 KiB. Measures the total amount of data that moves along the network path. |
| Latency |
The time it takes for an I/O request to complete, measured in milliseconds (ms). |
| Cache hit rate |
A measurement of how many content requests the NVMe cache of VMware Cloud Flex Storage can fulfill successfully, compared to how many requests it receives. A cache hit ratio of 90% and higher means that most of the requests are satisfied by the cache. A value under 80% indicates a working set that is substantially larger than supported by the cache. |
| Cloud storage - Used |
Used storage is the amount of data being consumed, which is the total sum of actual data stored on the datastore. It does not refer to provisioned storage or available storage remaining.
Note: In vCenter, NFS capacity metrics do not reflect billed usage and might display a different value.
|
| Clusters |
A list of all clusters currently mounted or being mounted to the datastore. |
