


The Multi-Instance Management Dashboard displays the inventory and capacity across the federation.
You access the
Multi-Instance Management Dashboard by clicking the Multi-Instance View icon in the top left corner of the
SDDC Manager UI.
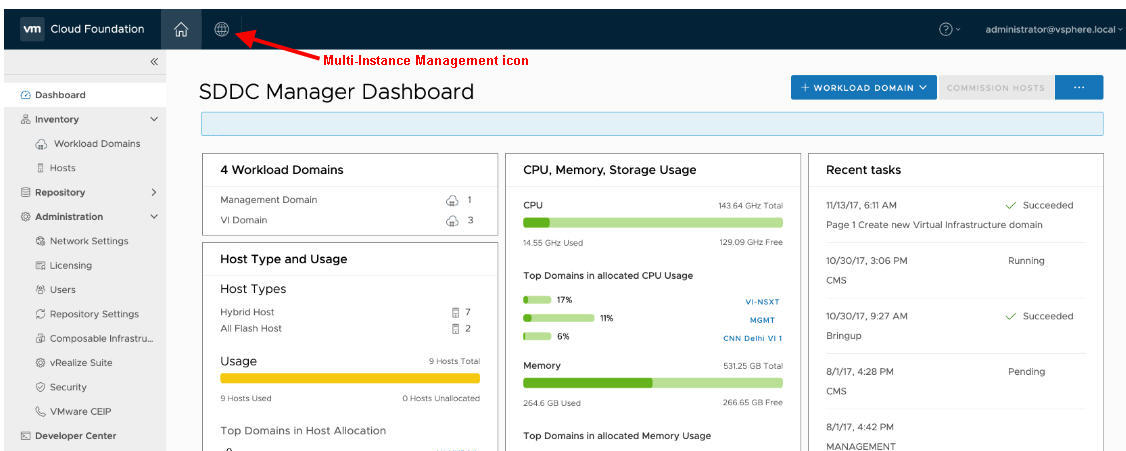
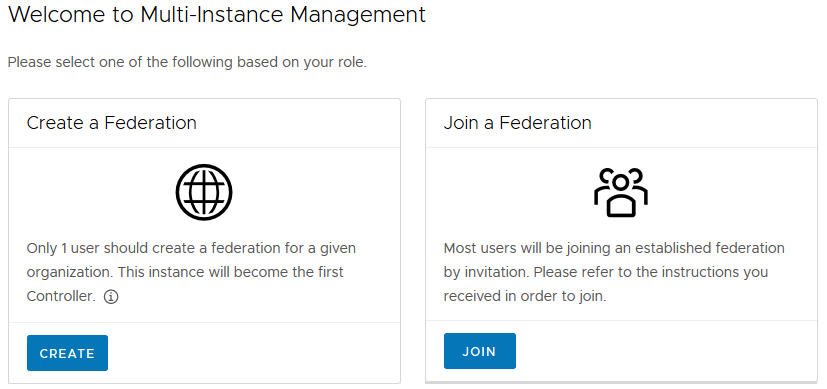
Before a federation is created, the dashboard displays the create and join options.
After a federation is created, the
Multi-Instance Management Dashboard displays a world map showing the federation members as dots on the map.
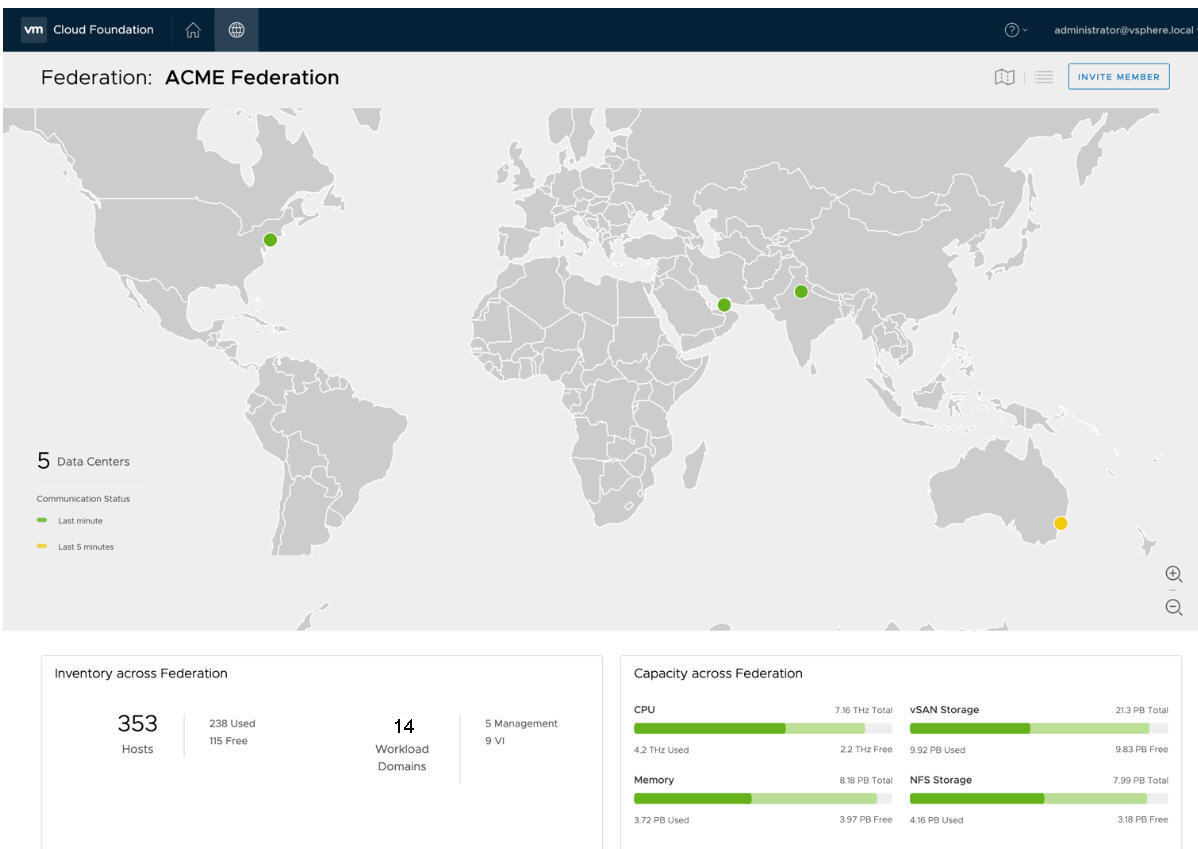
The dot color depends on the communication status between the federation members - green if they communicated within the last two minutes, yellow if they communicated within the previous five minutes, and red if they have not communicated for more than ten minutes. You can see the following information here:
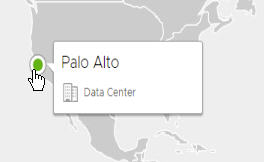
- Hover over a dot to see the member name and location.
- Click the member location dot to open a panel on the right side with detailed information about the SDDC Manager instance. The panel also displays available software updates.
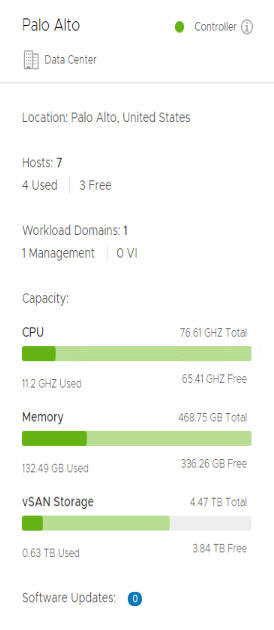
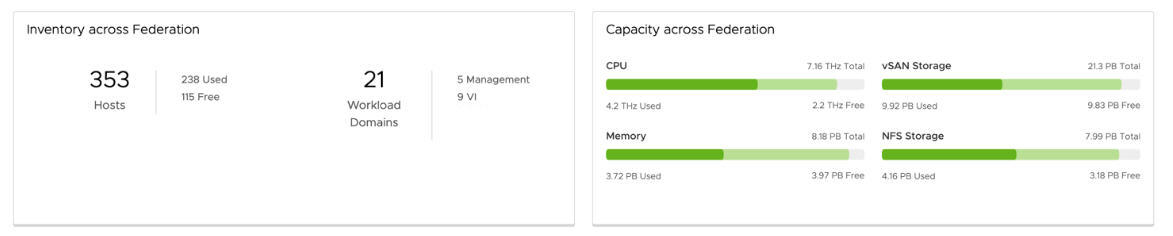
The Inventory section in the bottom half of the dashboard displays the number of hosts and workload domains along with a breakdown of the workload domain type. The capacity section displays the used and available CPU, memory, and storage across the federation.
Click the Table icon at the top right of the dashboard to display member information in a grid format. Information for all federation members is displayed in a tabular format.
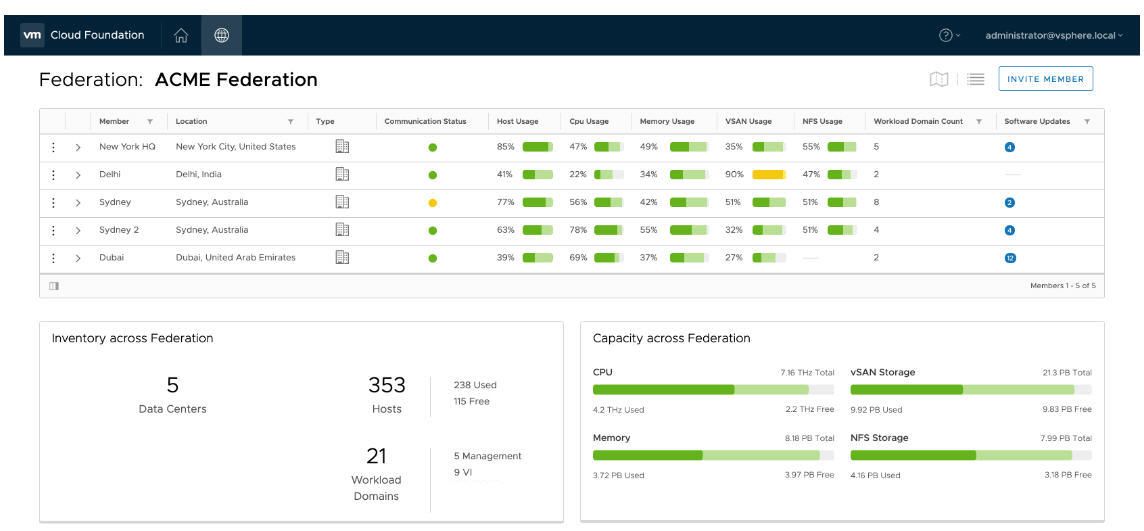
Clicking the arrow ( ) next to the member name displays the CPU, memory, and storage usage for that member.
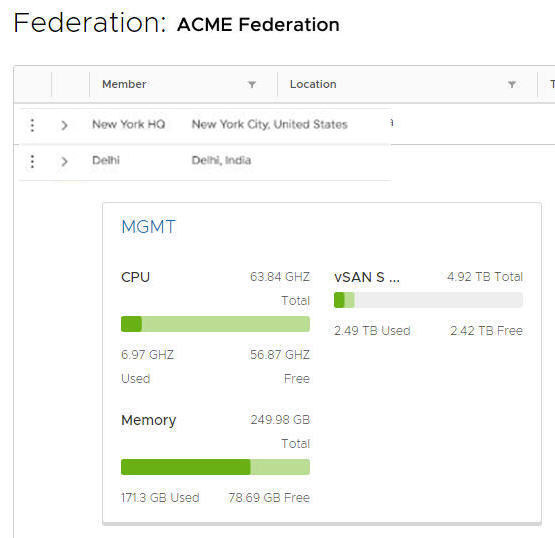
Clicking MGMT takes you to the management domain of that member.
