View the results of the configured Cloud Web Security policies for an enterprise from the Monitor tab in the Cloud Web Security page in the New Orchestrator UI portal.
Procedure
- In the Orchestrator portal, click the Open New Orchestrator UI option available at the top of the Window.
- Click Launch New Orchestrator UI in the pop-up window. The UI opens in a new tab.
- From the SD-WAN drop-down menu, select Cloud Web Security.
The Cloud Web Security page appears.
- Click the Monitor tab.
Under the Monitoring section of Cloud Web Security, you can view the following three monitoring options:
- Threat Analysis
- Traffic Analysis
- Web Logs
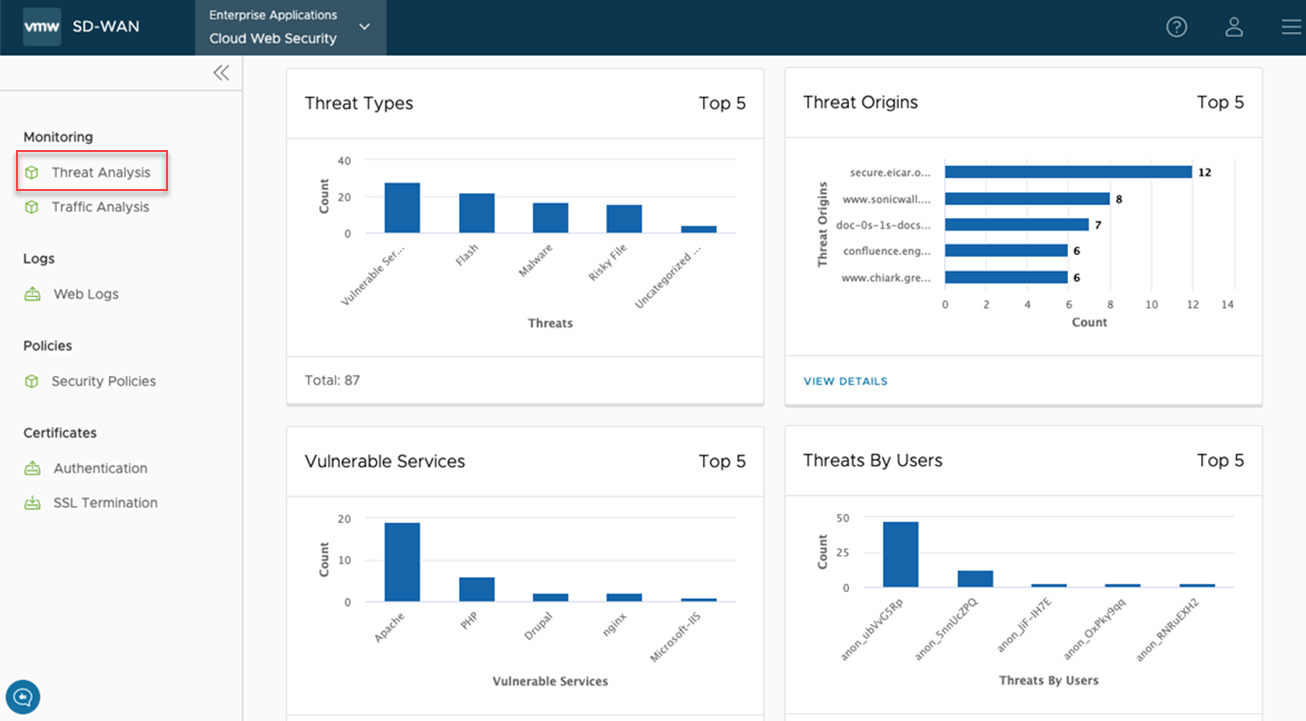
The Threat Analysis dashboard ensures that a user can get detailed visibility into threats. The dashboard displays:
- Threat Types
- Threat Origins
- Vulnerable Services
- Threats By Users

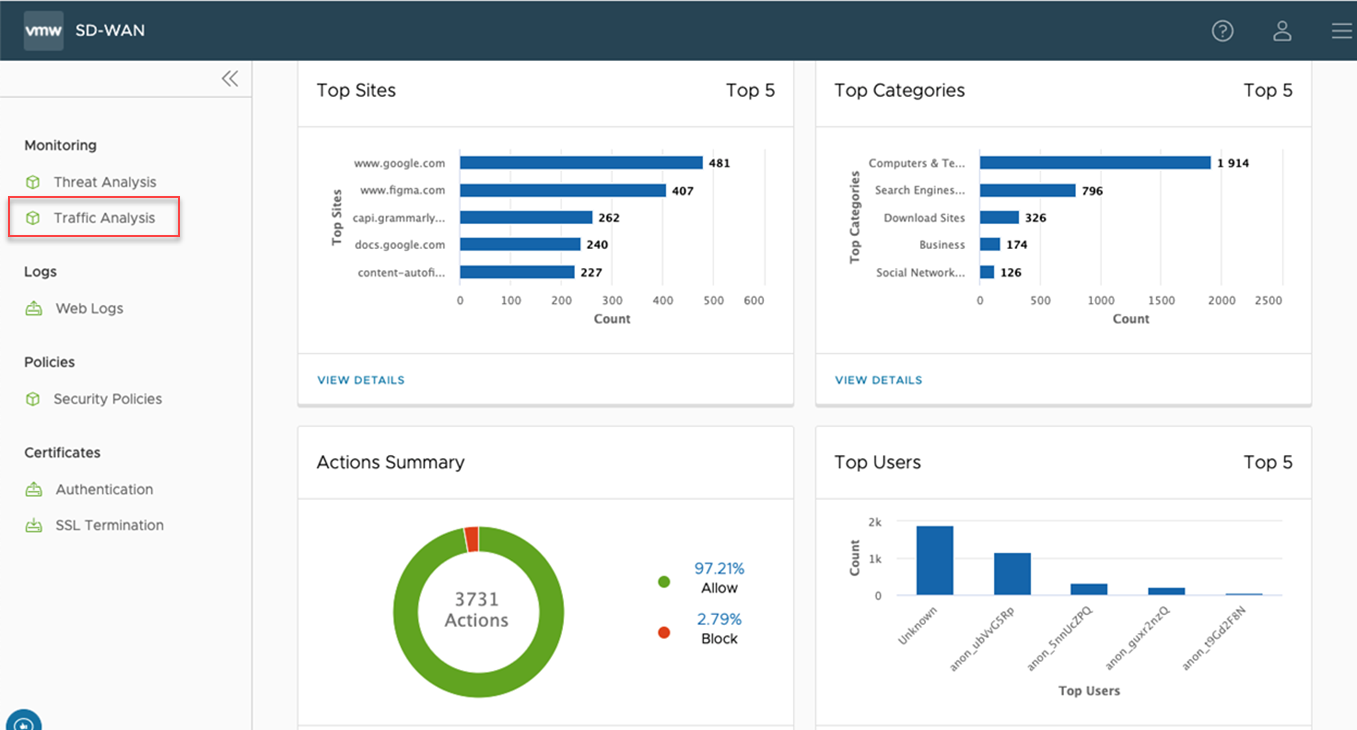
The Traffic Analysis dashboard ensures that a user can get detailed visibility into user traffic. The dashboard displays:
- Top Sites being visited by users
- Top Categories for traffic
- Actions Summary, the percentage of traffic being allowed/blocked
- Top Users

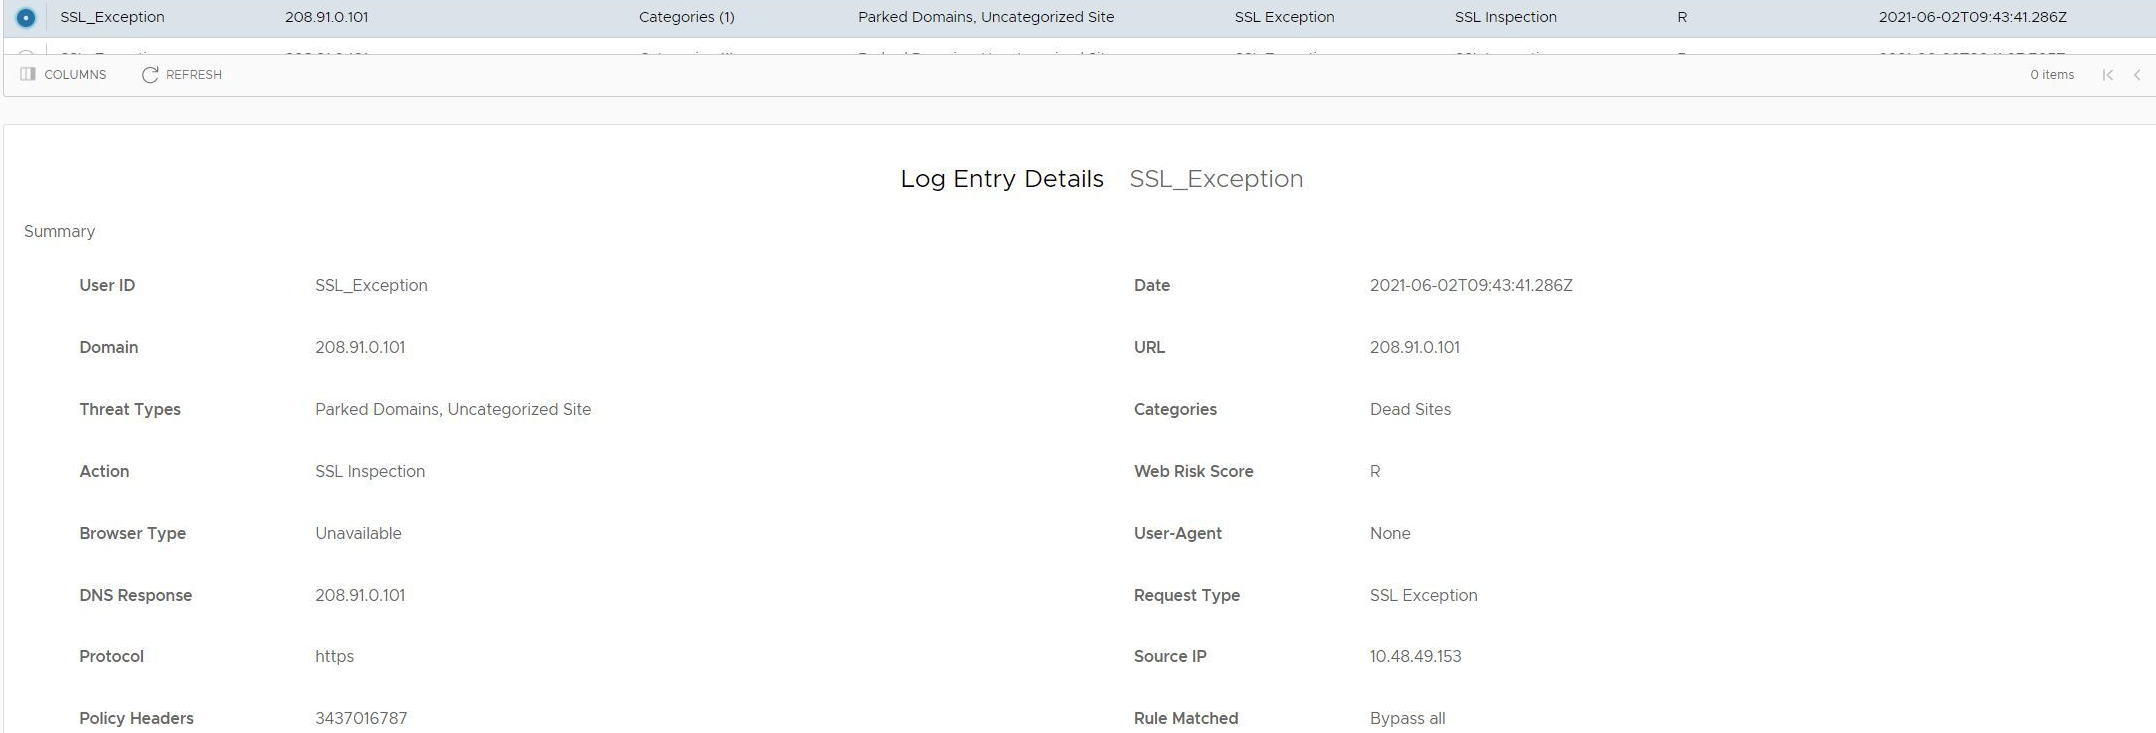
Web Logs
Cloud Web Security logs every session and threat. On the Web Logs page, a user may view a list of logs, scrolling through the full list. Any log entry may be selected and a Log Entry Details screen will populate below the Web Logs list, giving granular detail on that particular log entry.