


User can view the results of the configured Security policies for an Enterprise from the Monitor tab in the Cloud Web Security page in the VMware Cloud Orchestrator UI portal.
- In the VMware Cloud Orchestrator UI portal, from the SD-WAN drop-down menu, select Cloud Web Security. The Cloud Web Security page appears.
- Click the Monitor tab.
- Under the Monitor section of Cloud Web Security page, Users can view the following monitoring options:
- Overview
- Threat Analysis
- Traffic Analysis
- CASB Analysis
- DLP
- Logs (Web and DLP)
- Log Export
- Events
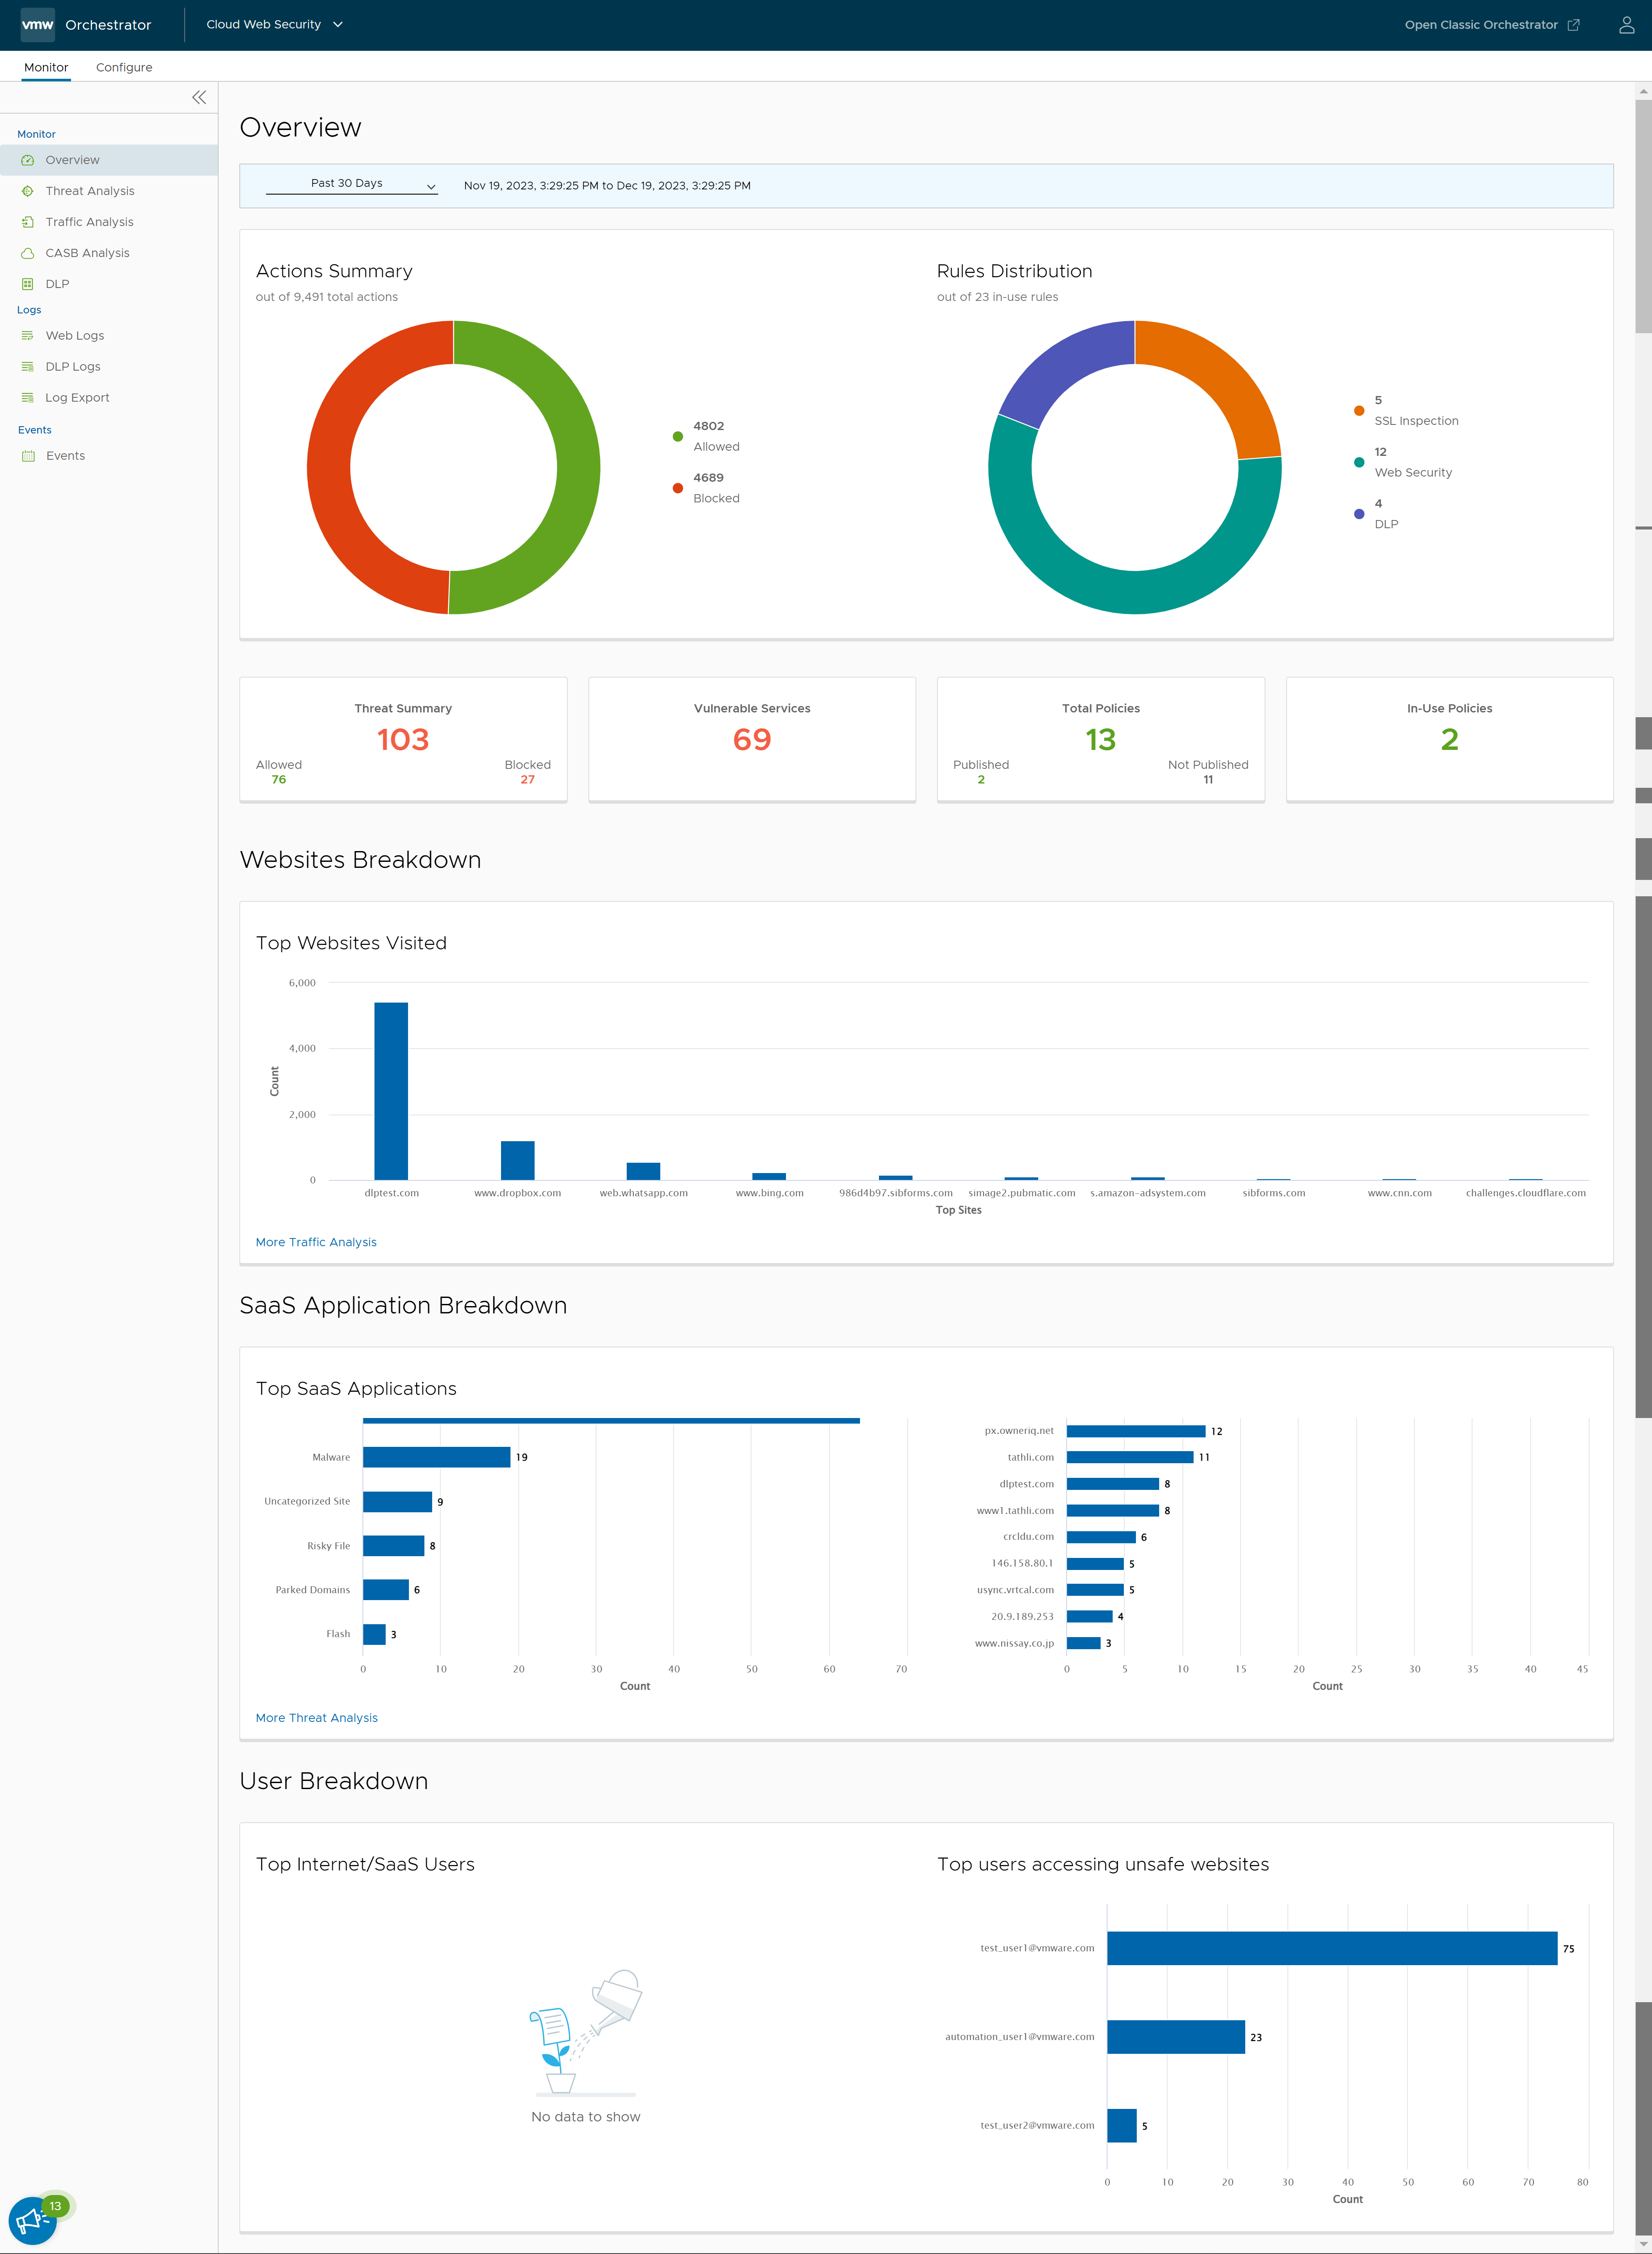
Overview
The Overview dashboard presents a cleaner, more accessible presentation of critical information on a single page, while also pointing the user to more detailed information for each data category. The top graphs provide a user with the Cloud Web Security Actions Summary (actions taken over the configured time period), and the current Rules Distribution for that customer.
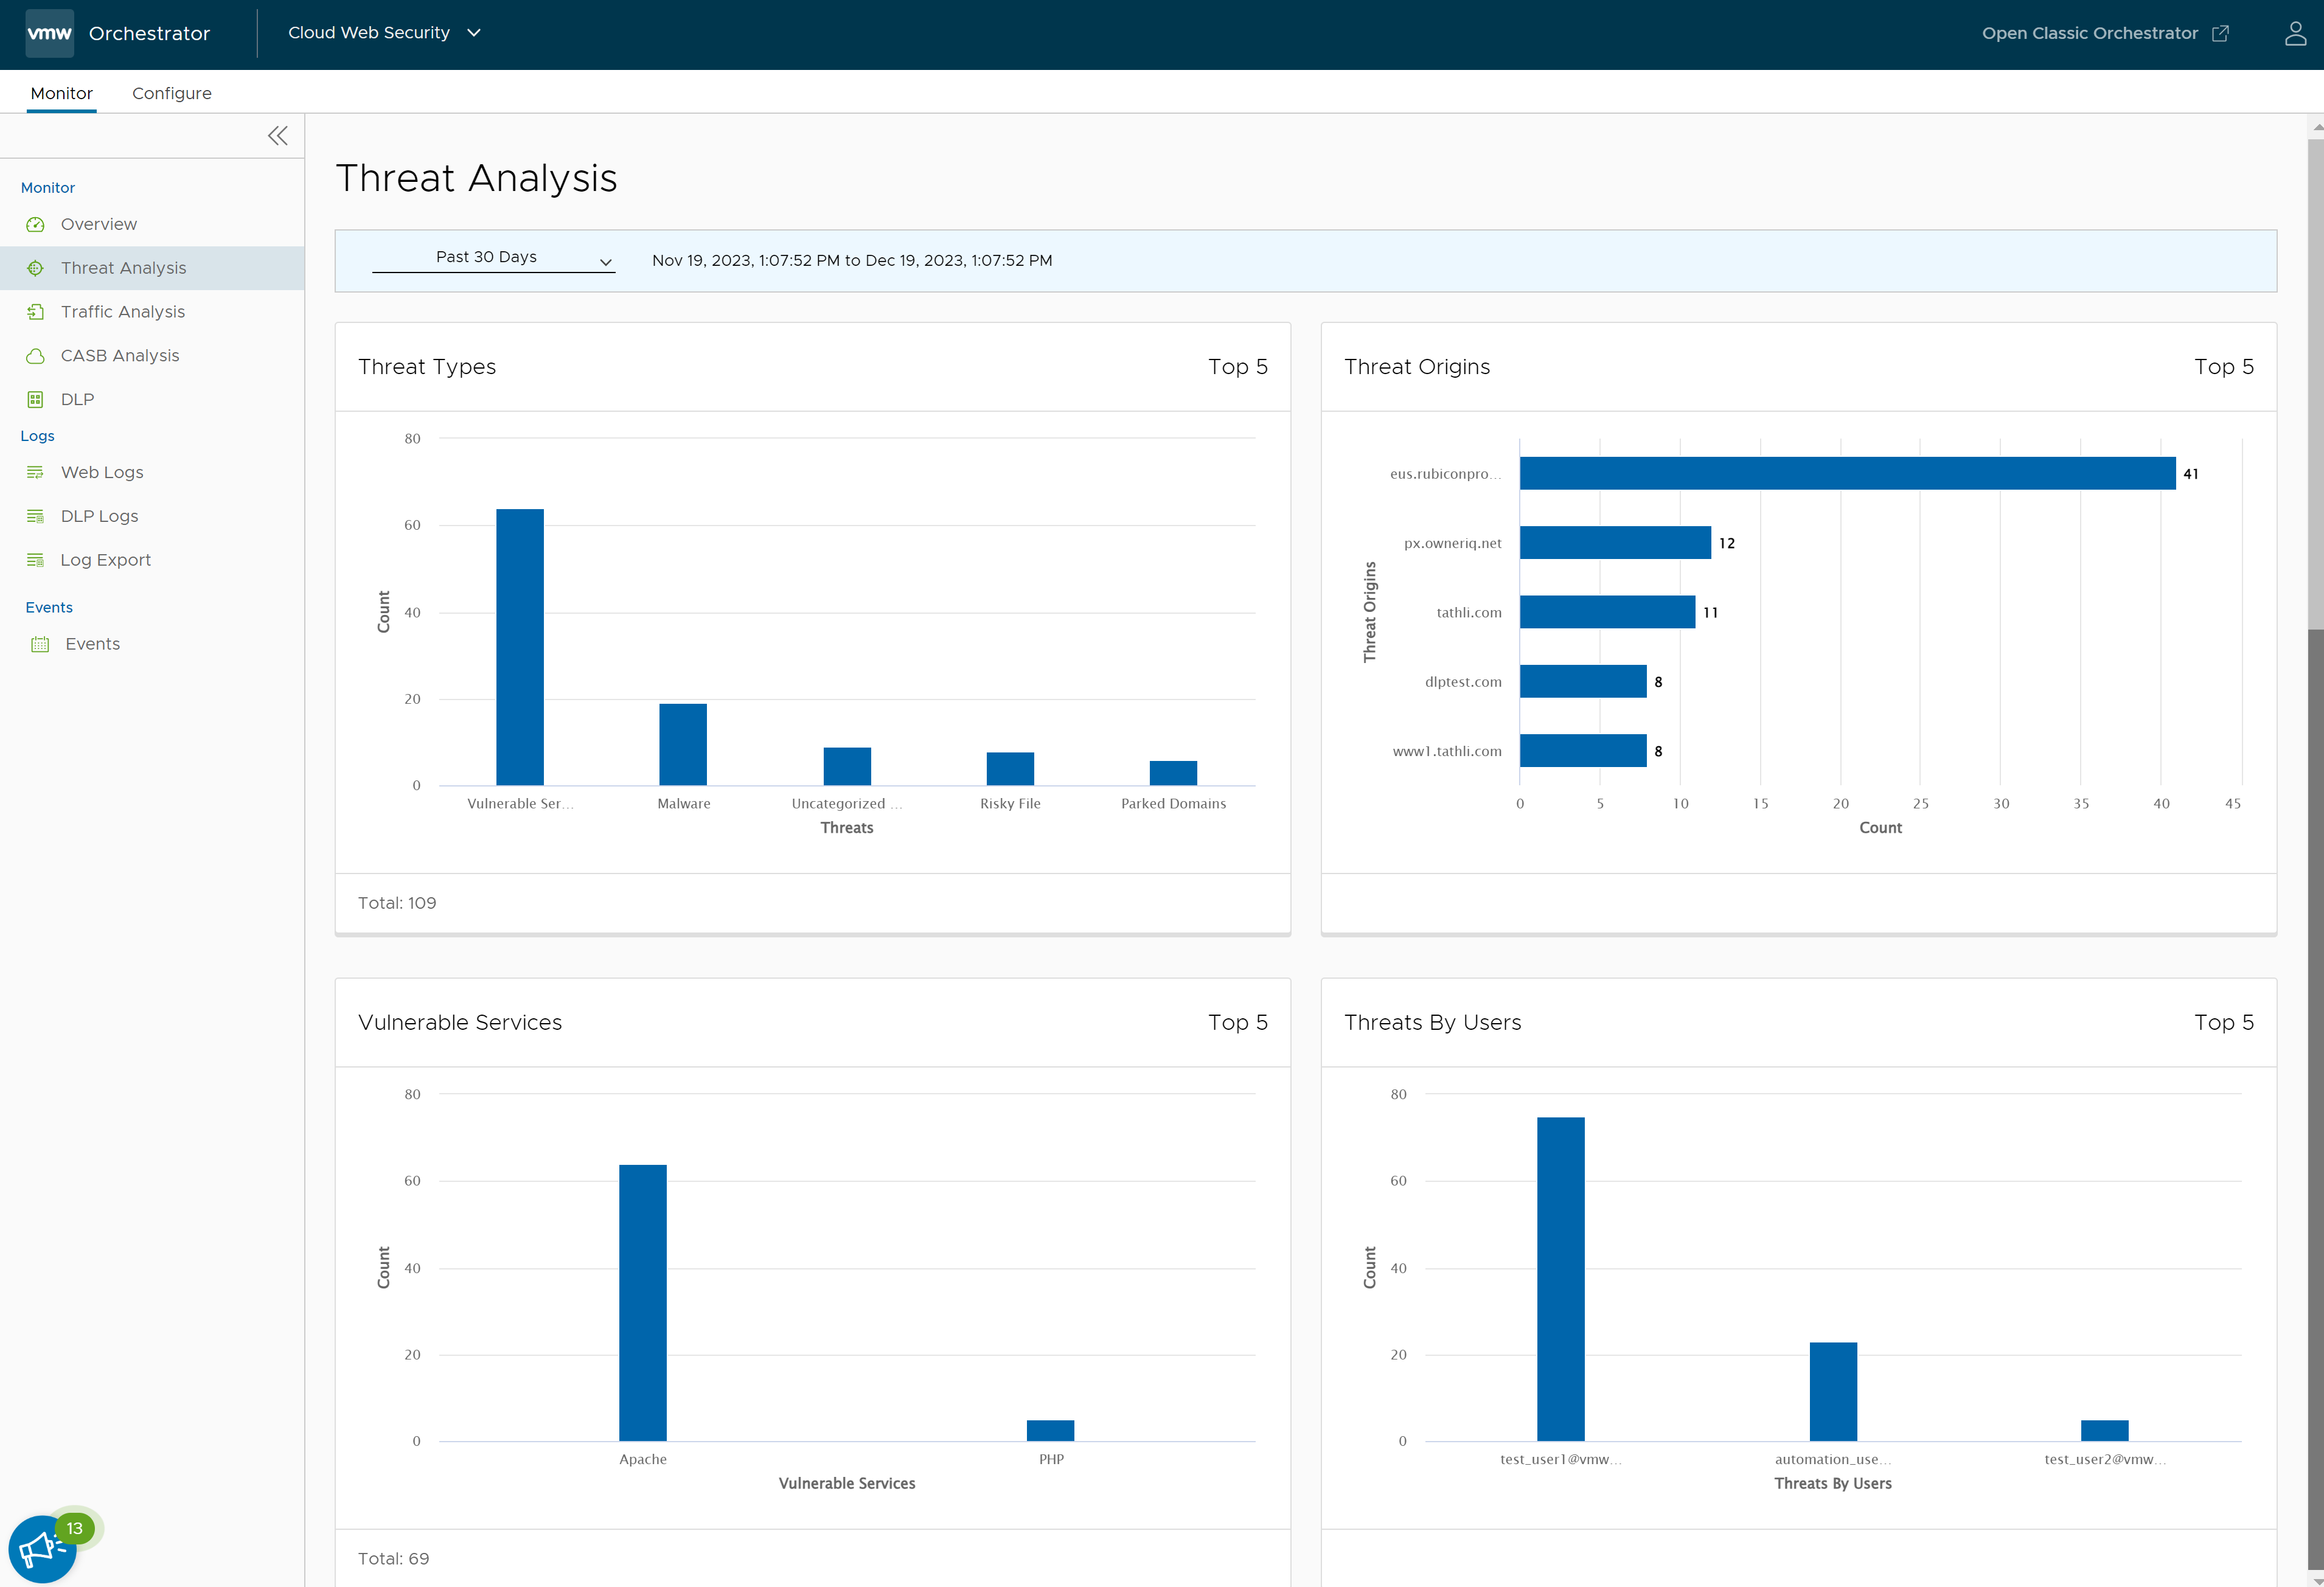
Threat Analysis
- Threat Types
- Threat Origins
- Vulnerable Services
- Threats By Users
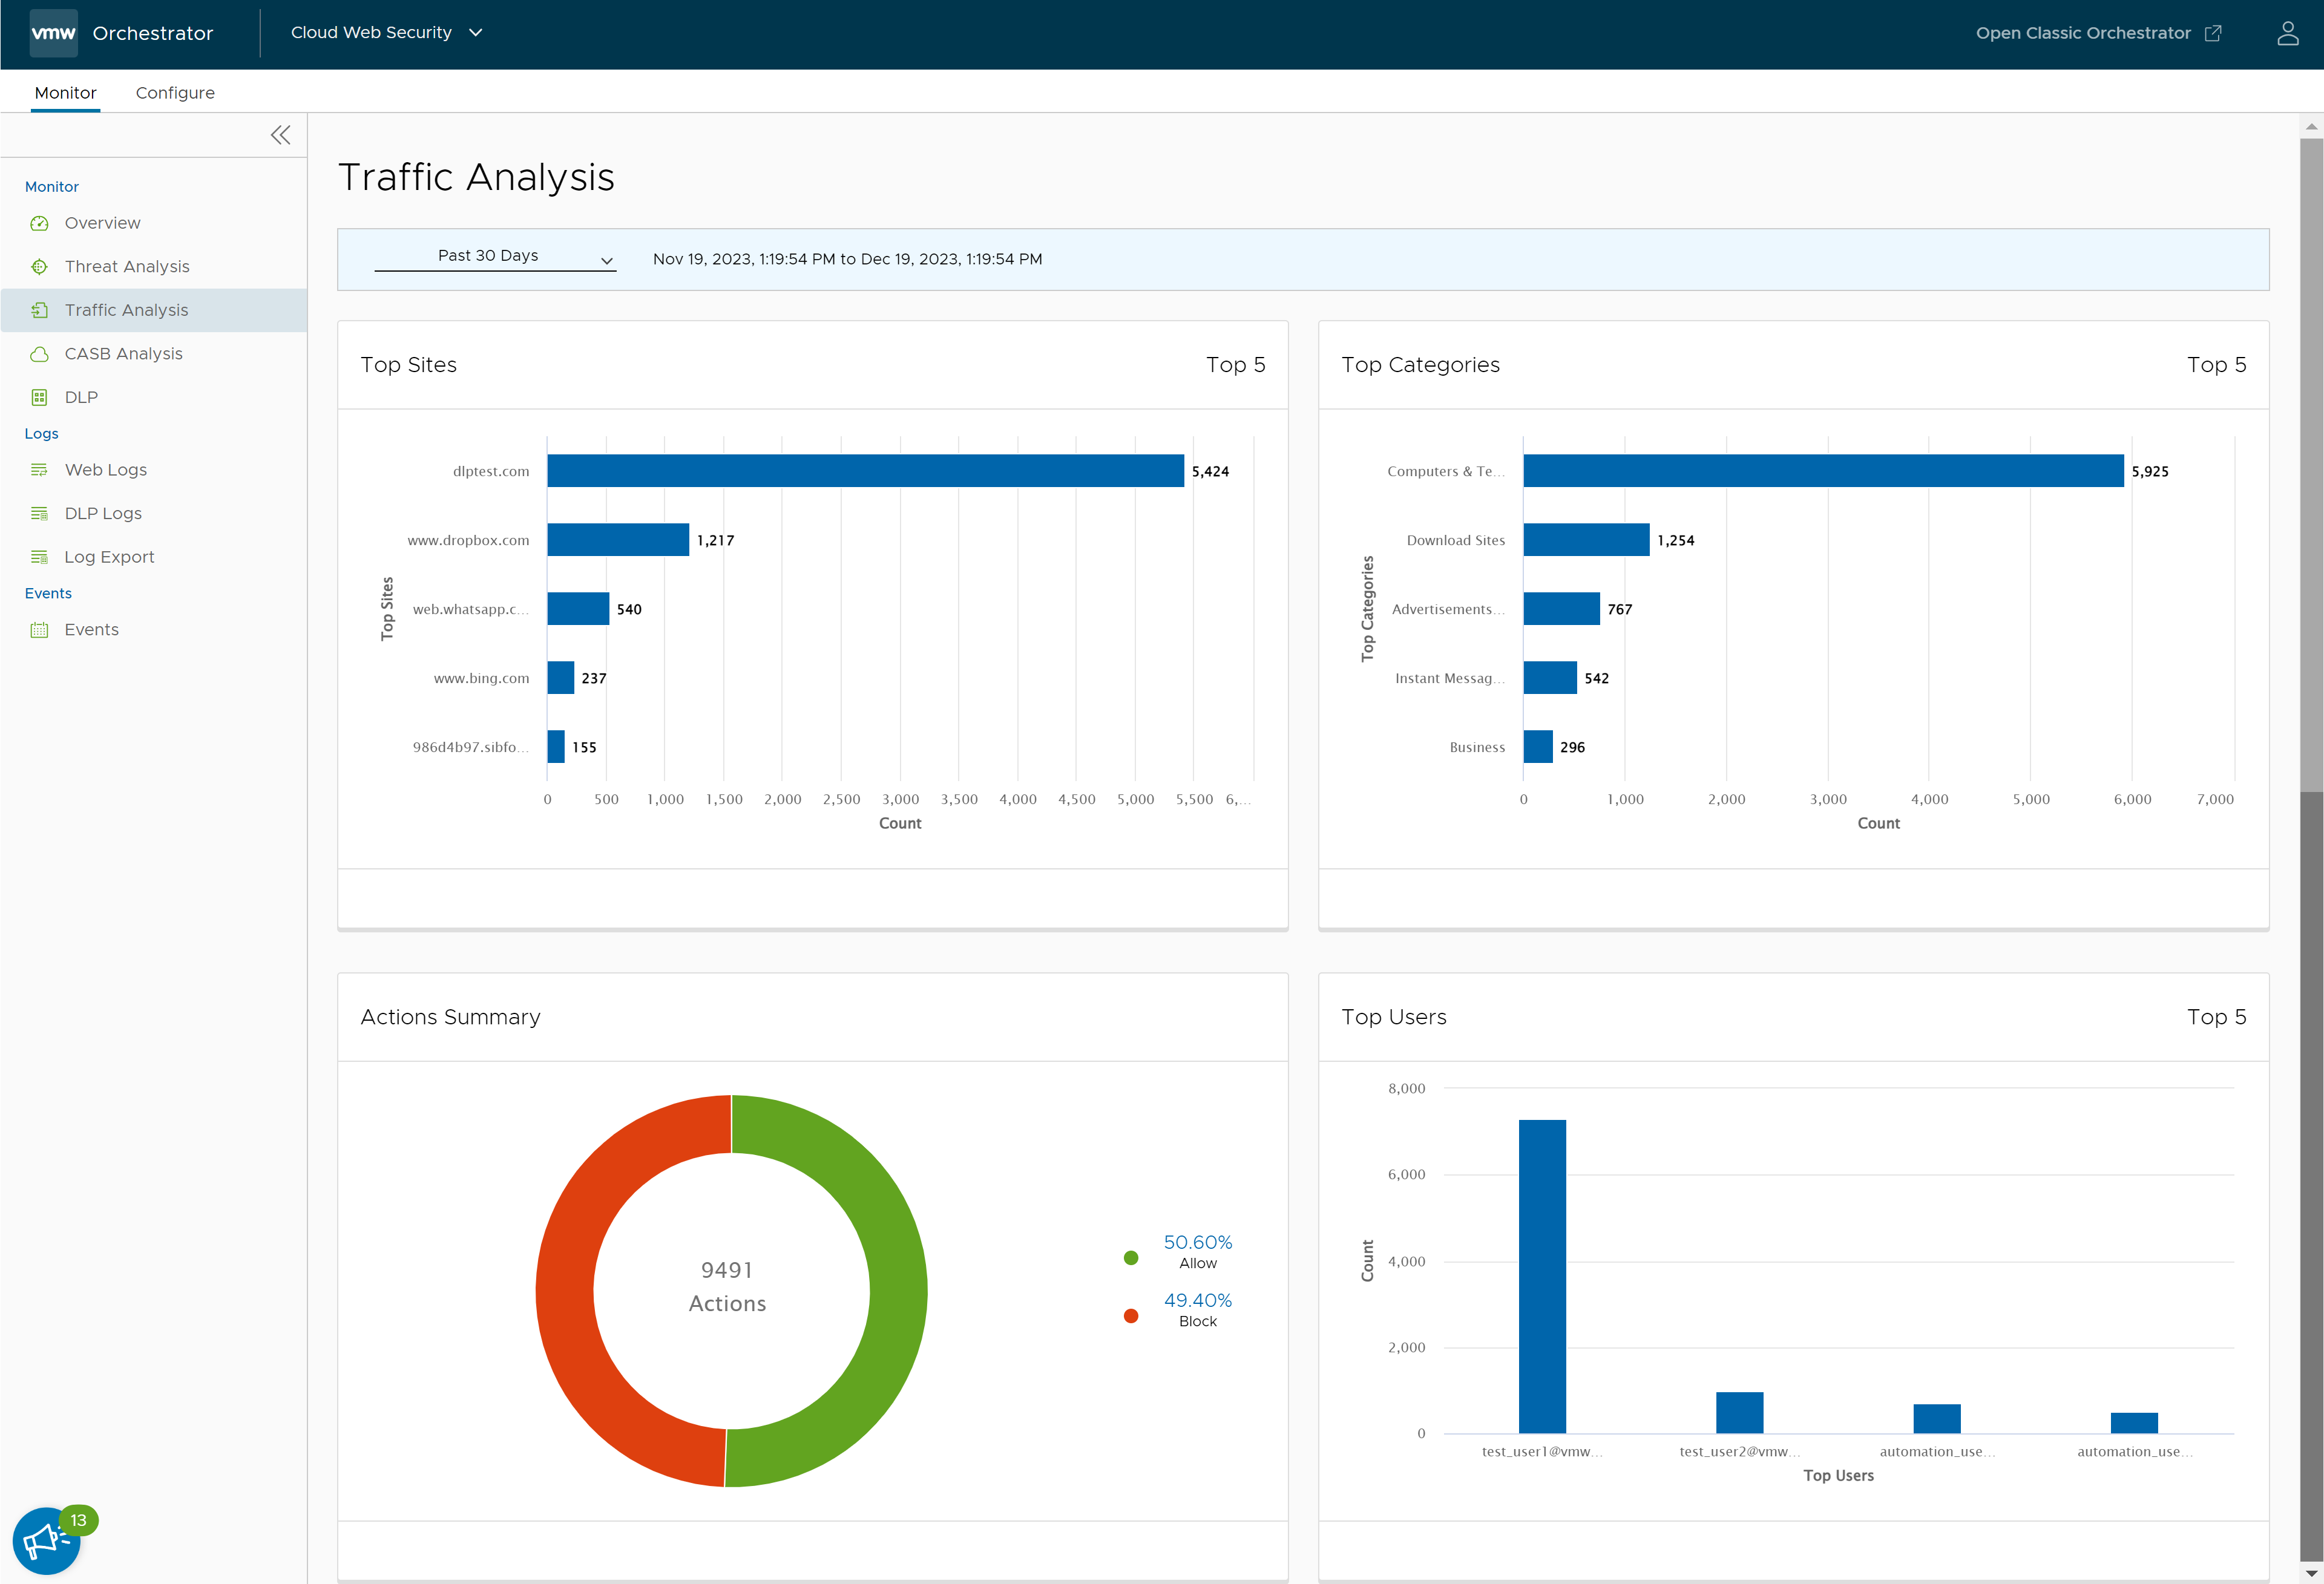
Traffic Analysis
- Top Sites being visited by users
- Top Categories for traffic
- Actions Summary, the percentage of traffic being allowed/blocked
- Top Users
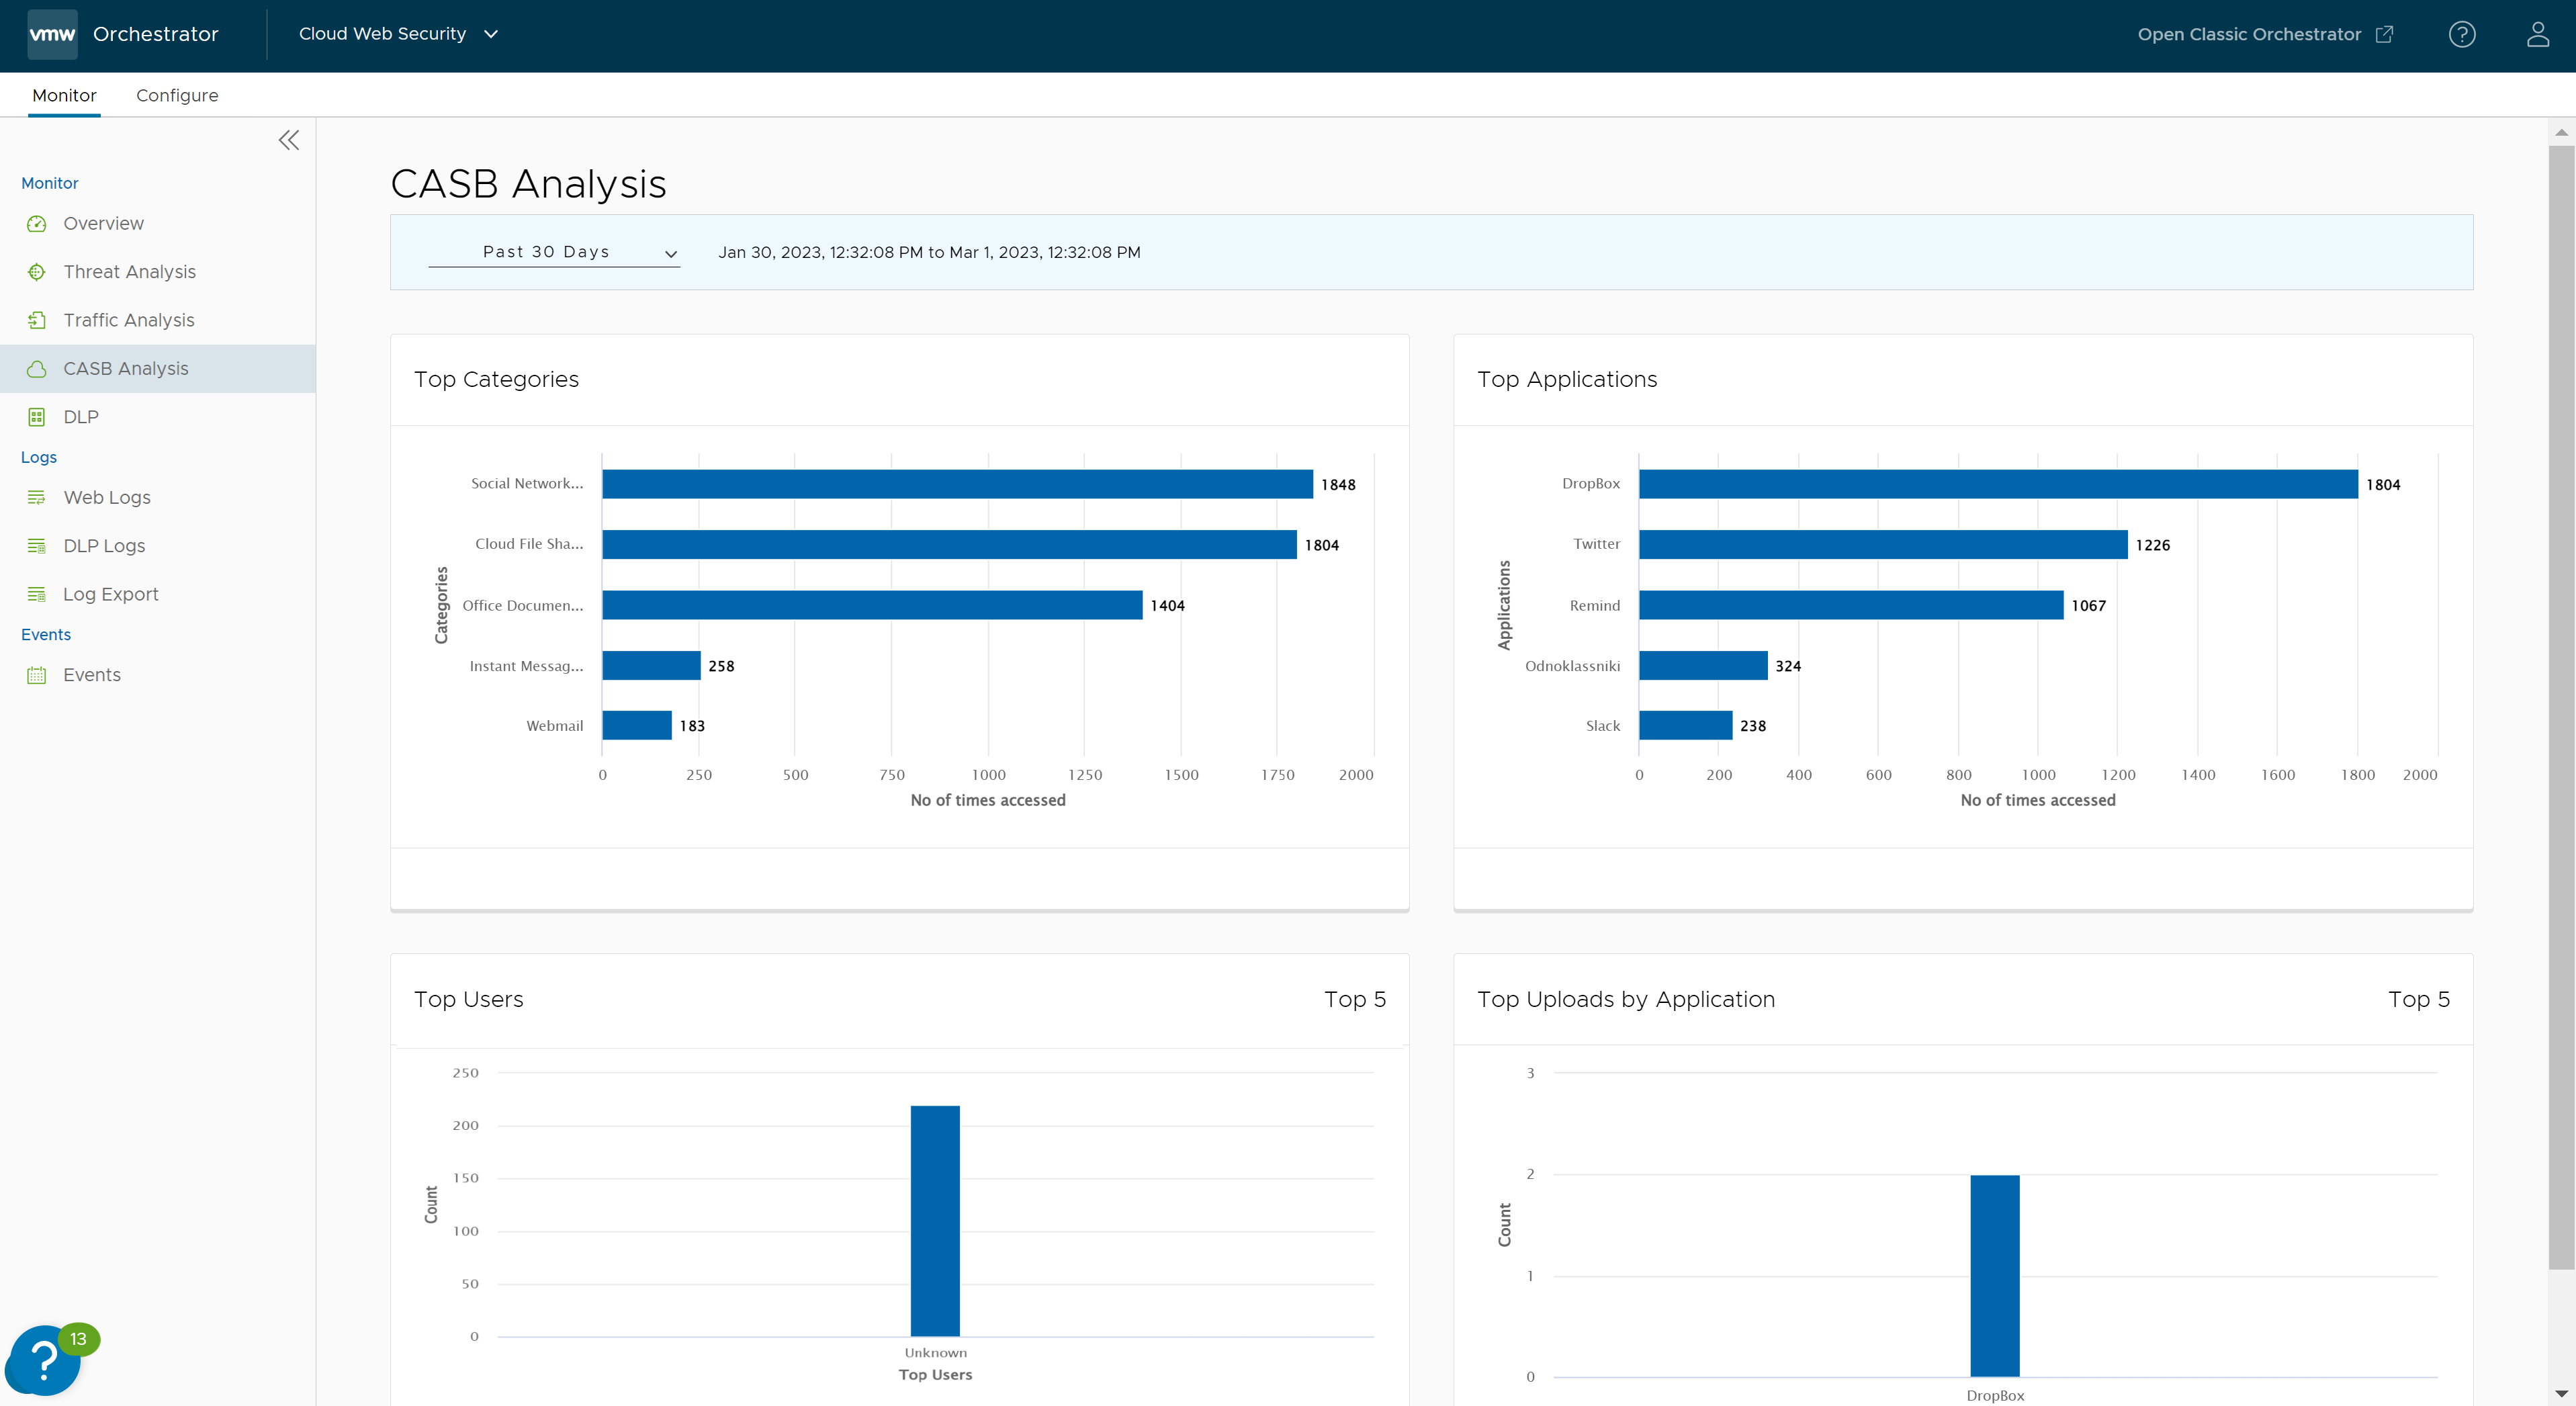
CASB Analysis
- Top Categories for traffic
- Top Applications
- Top Users
- Top Uploads by Applications
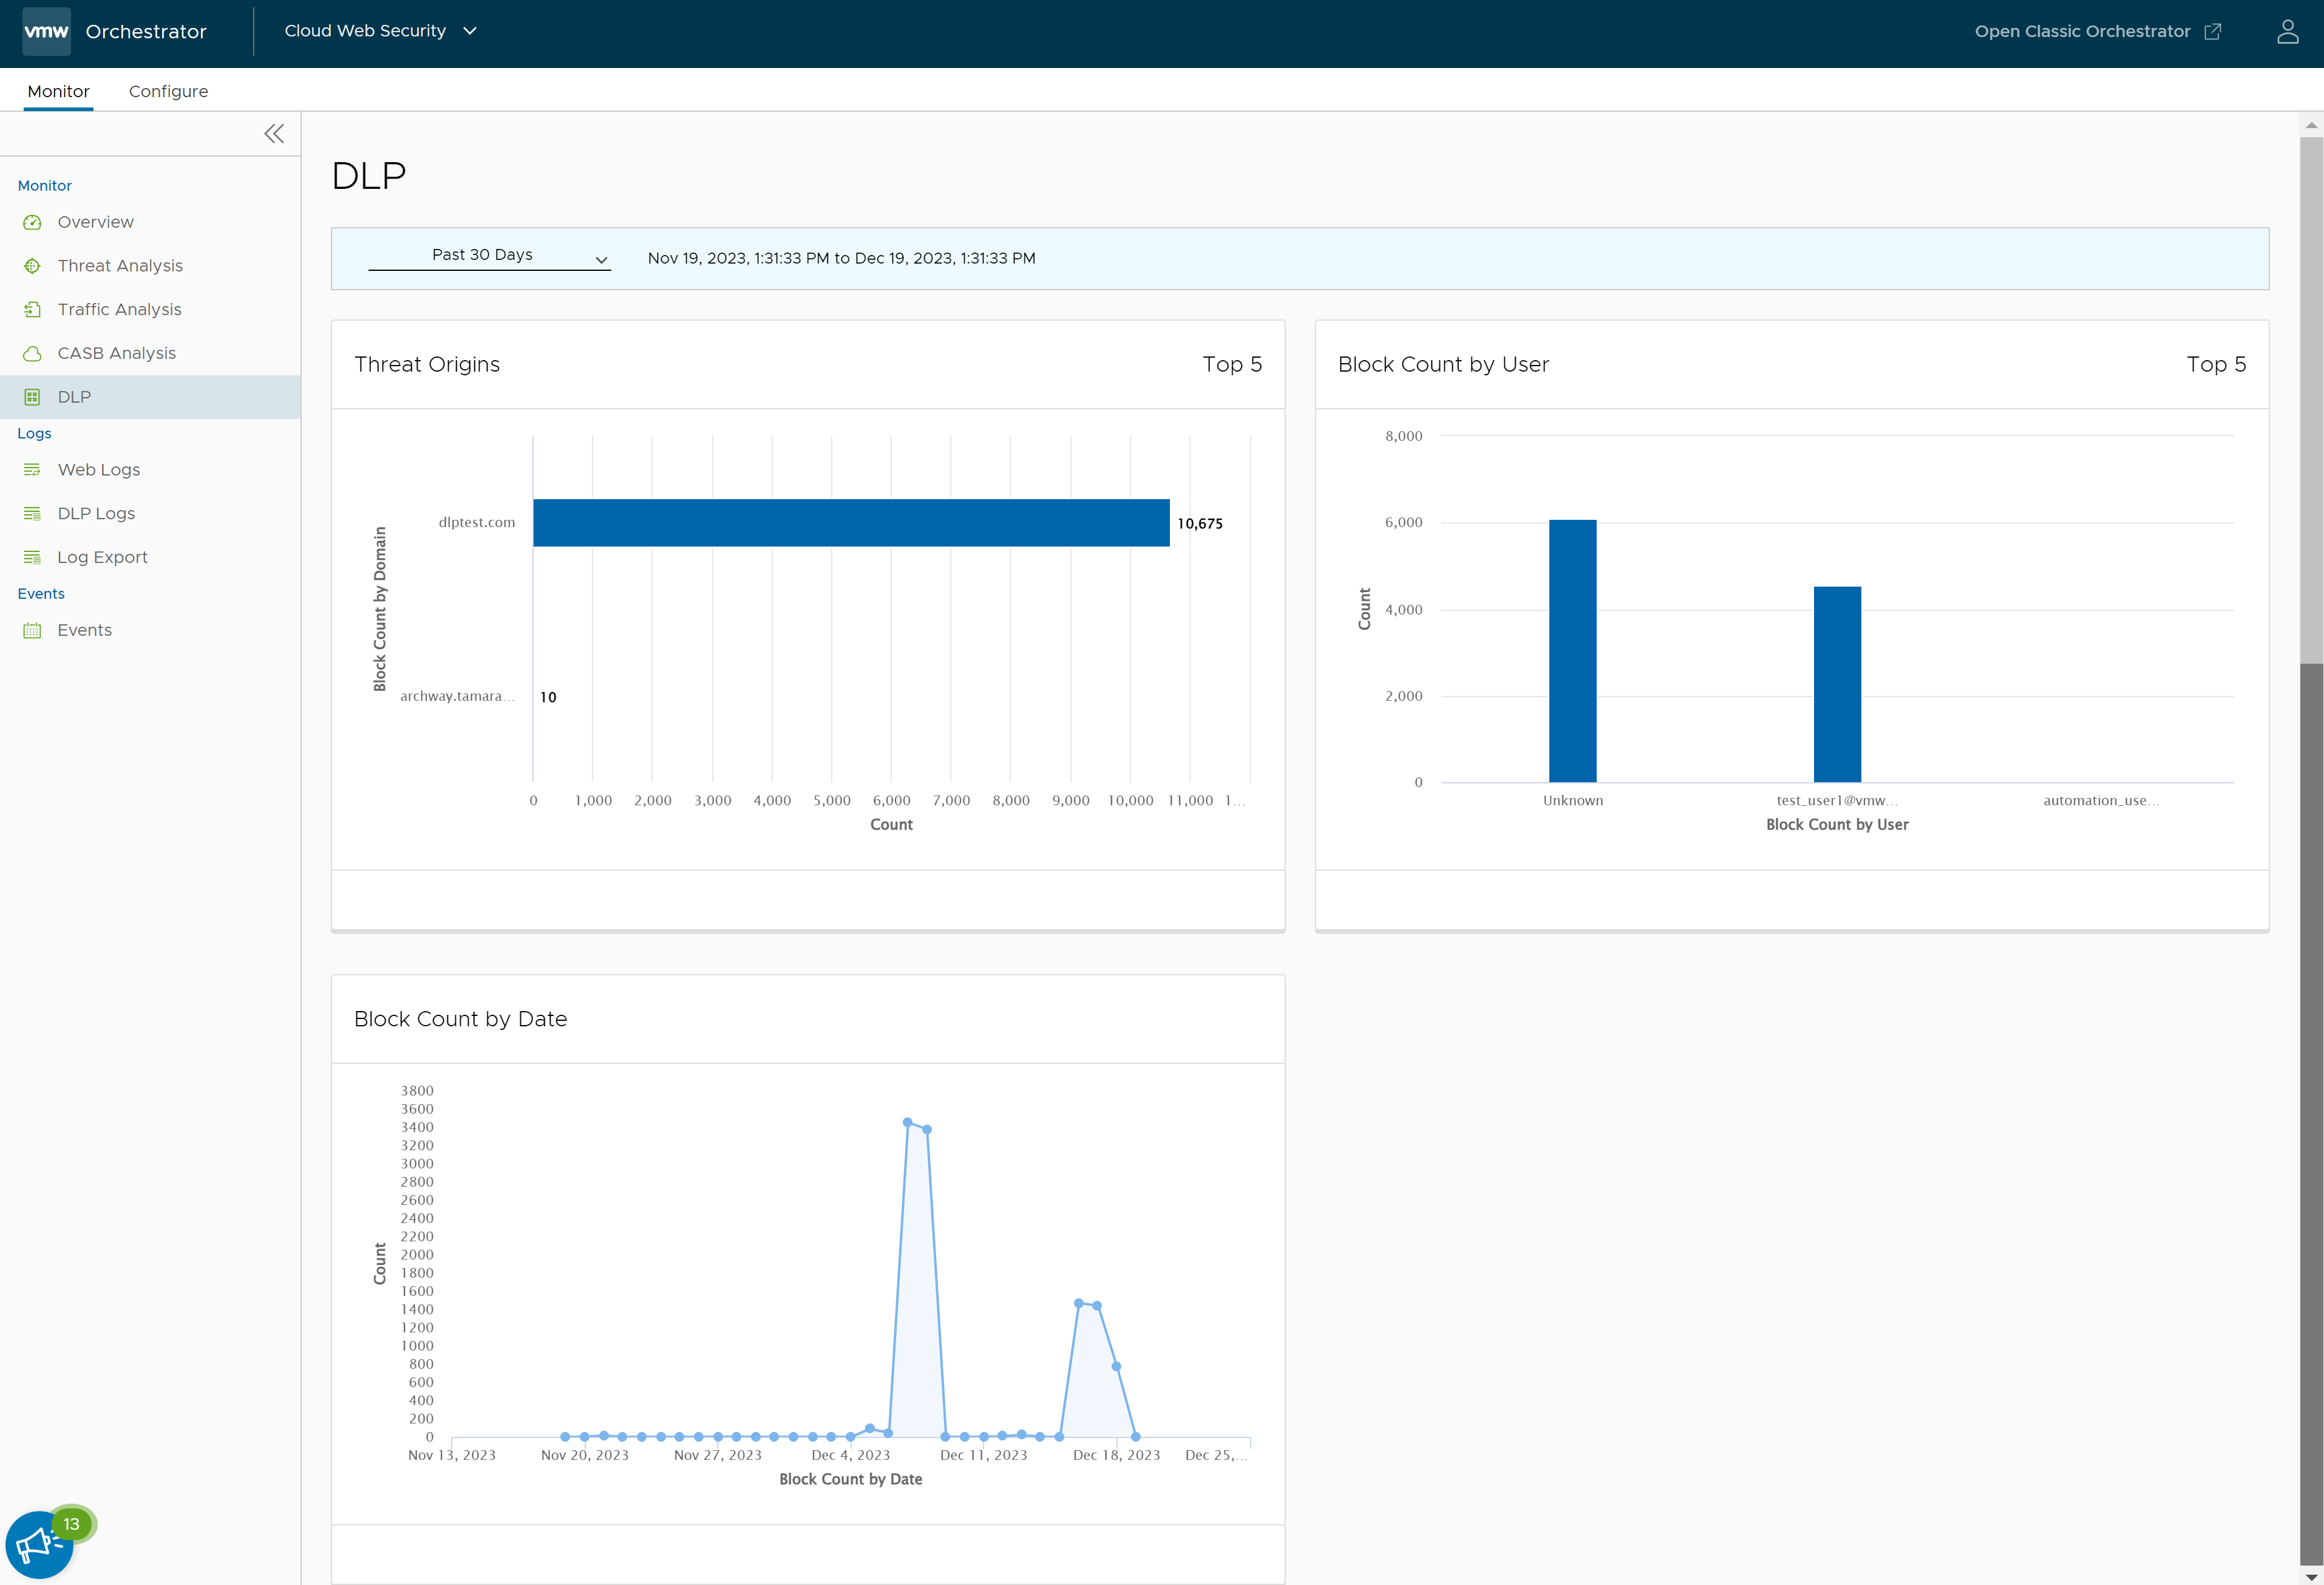
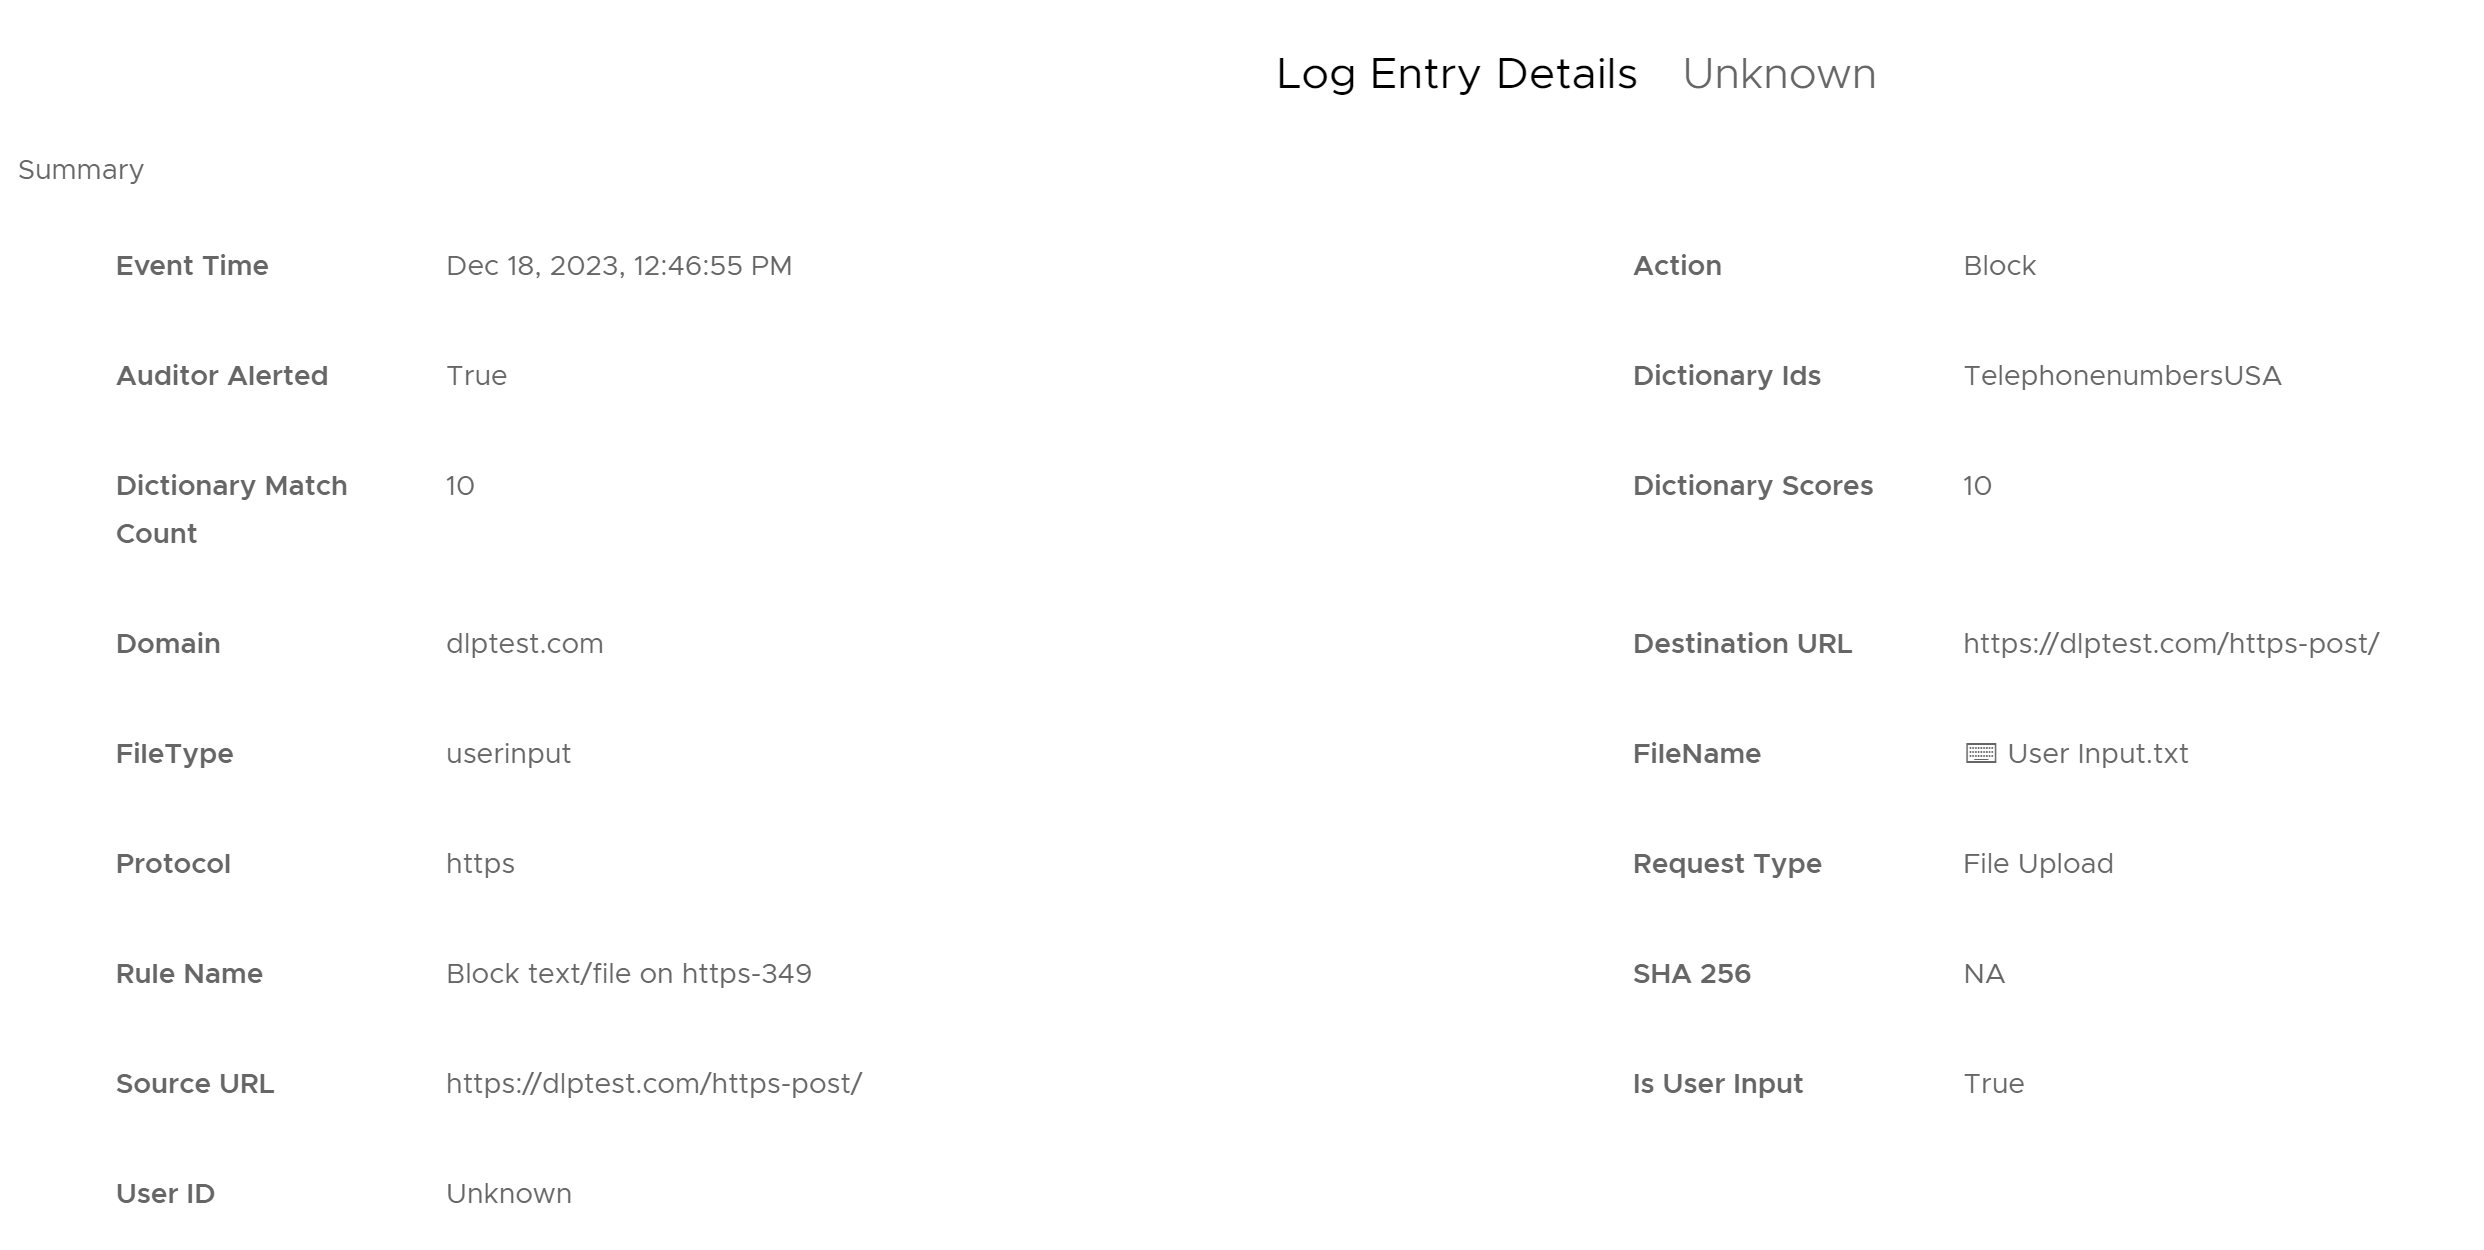
DLP
- Threat Origins
- Block Count by User
- Block Count by Date
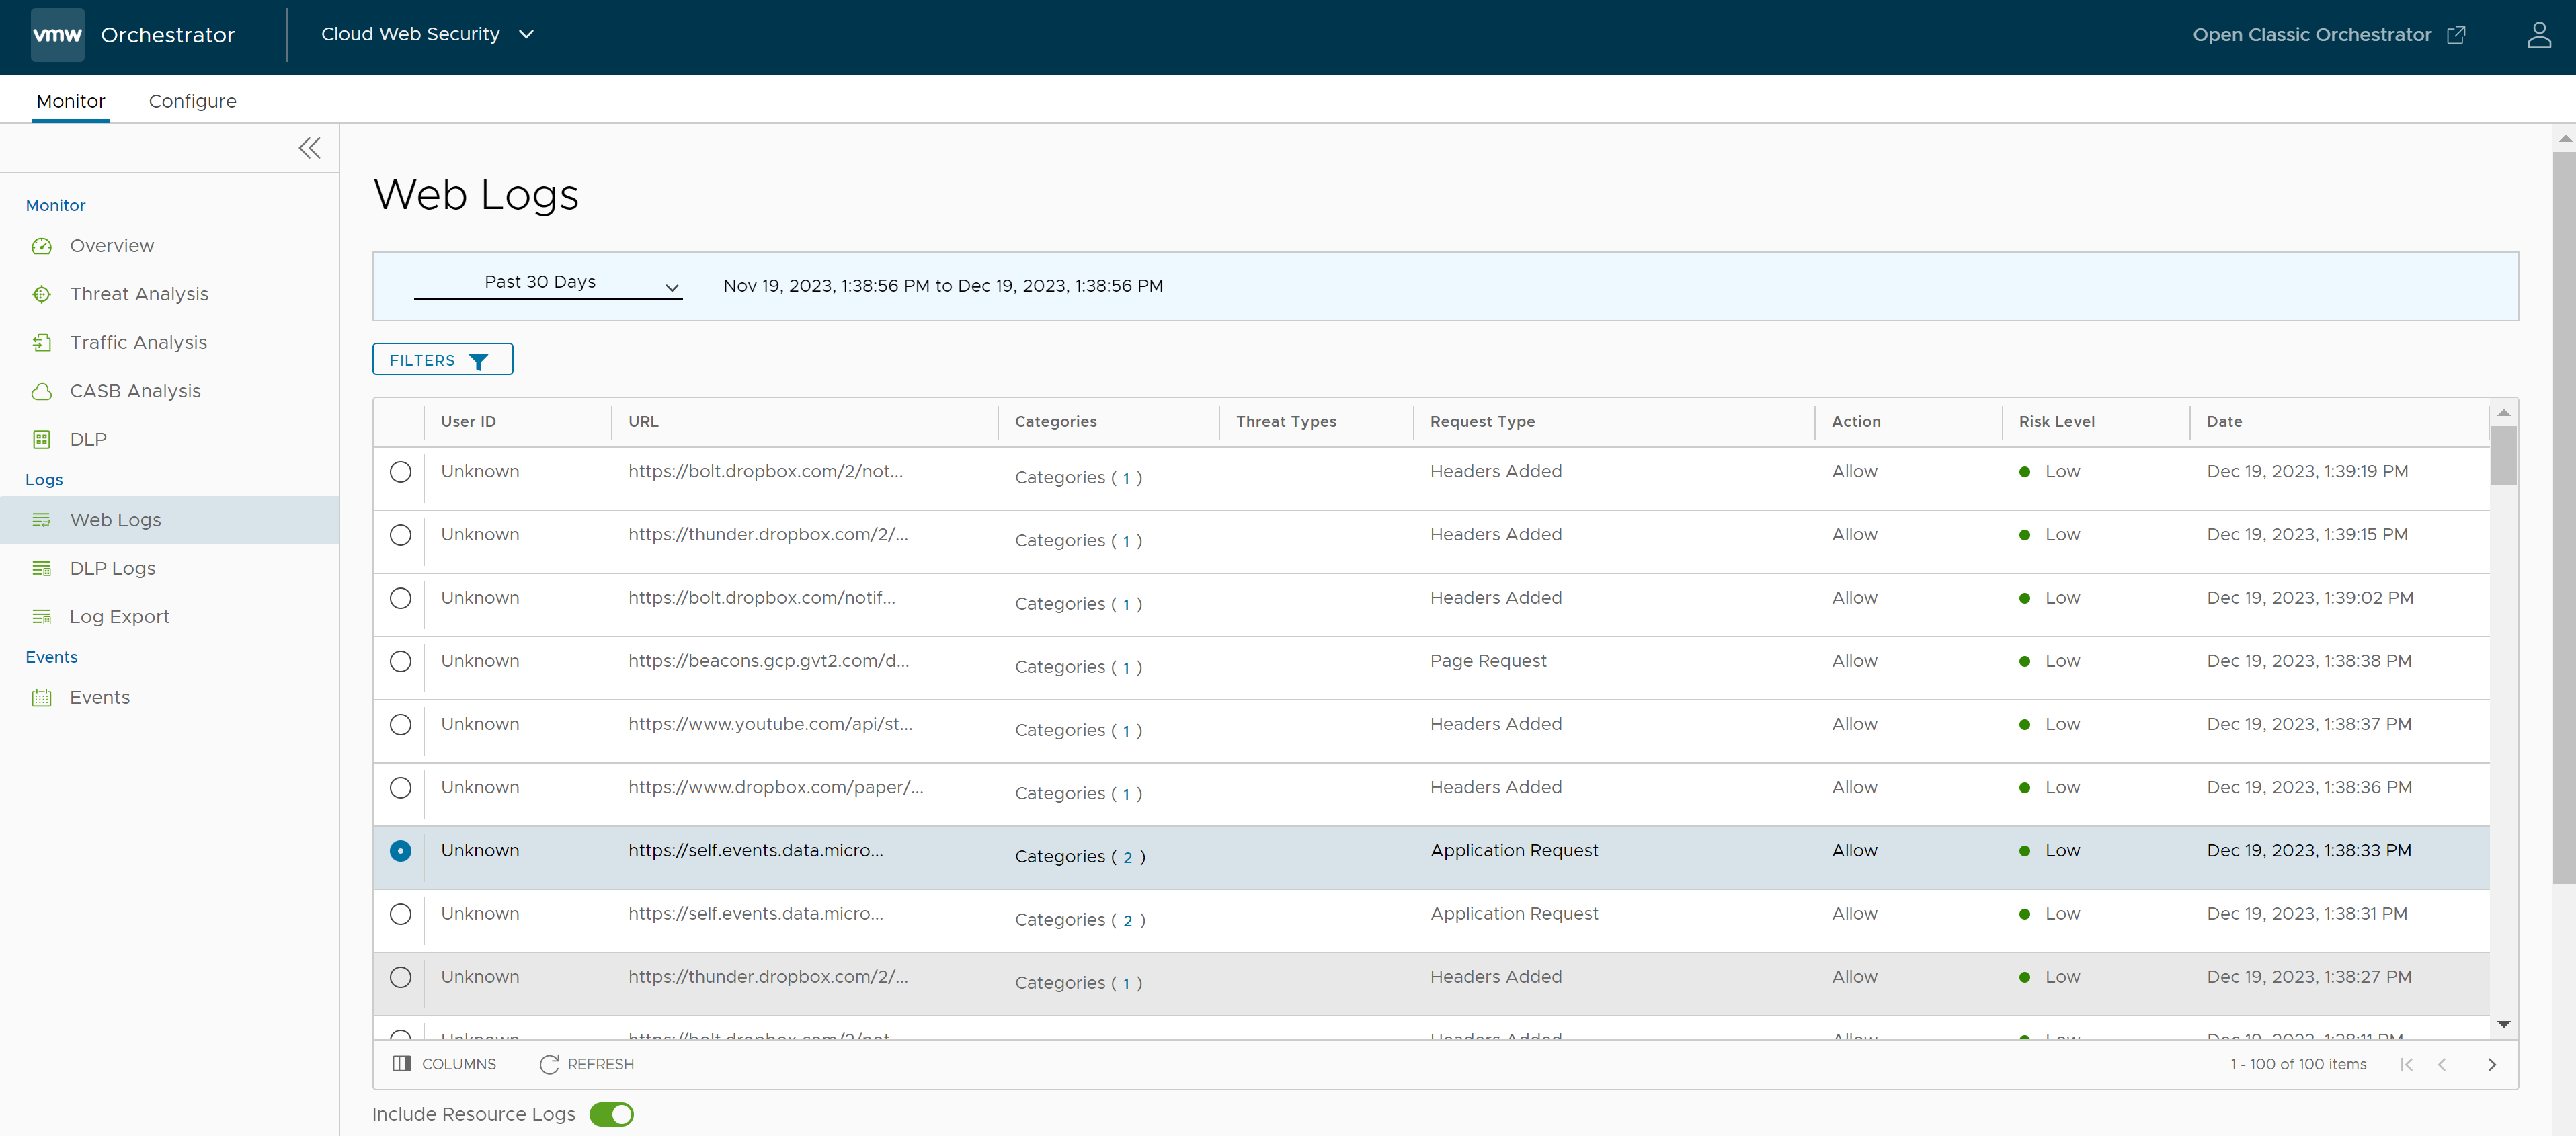
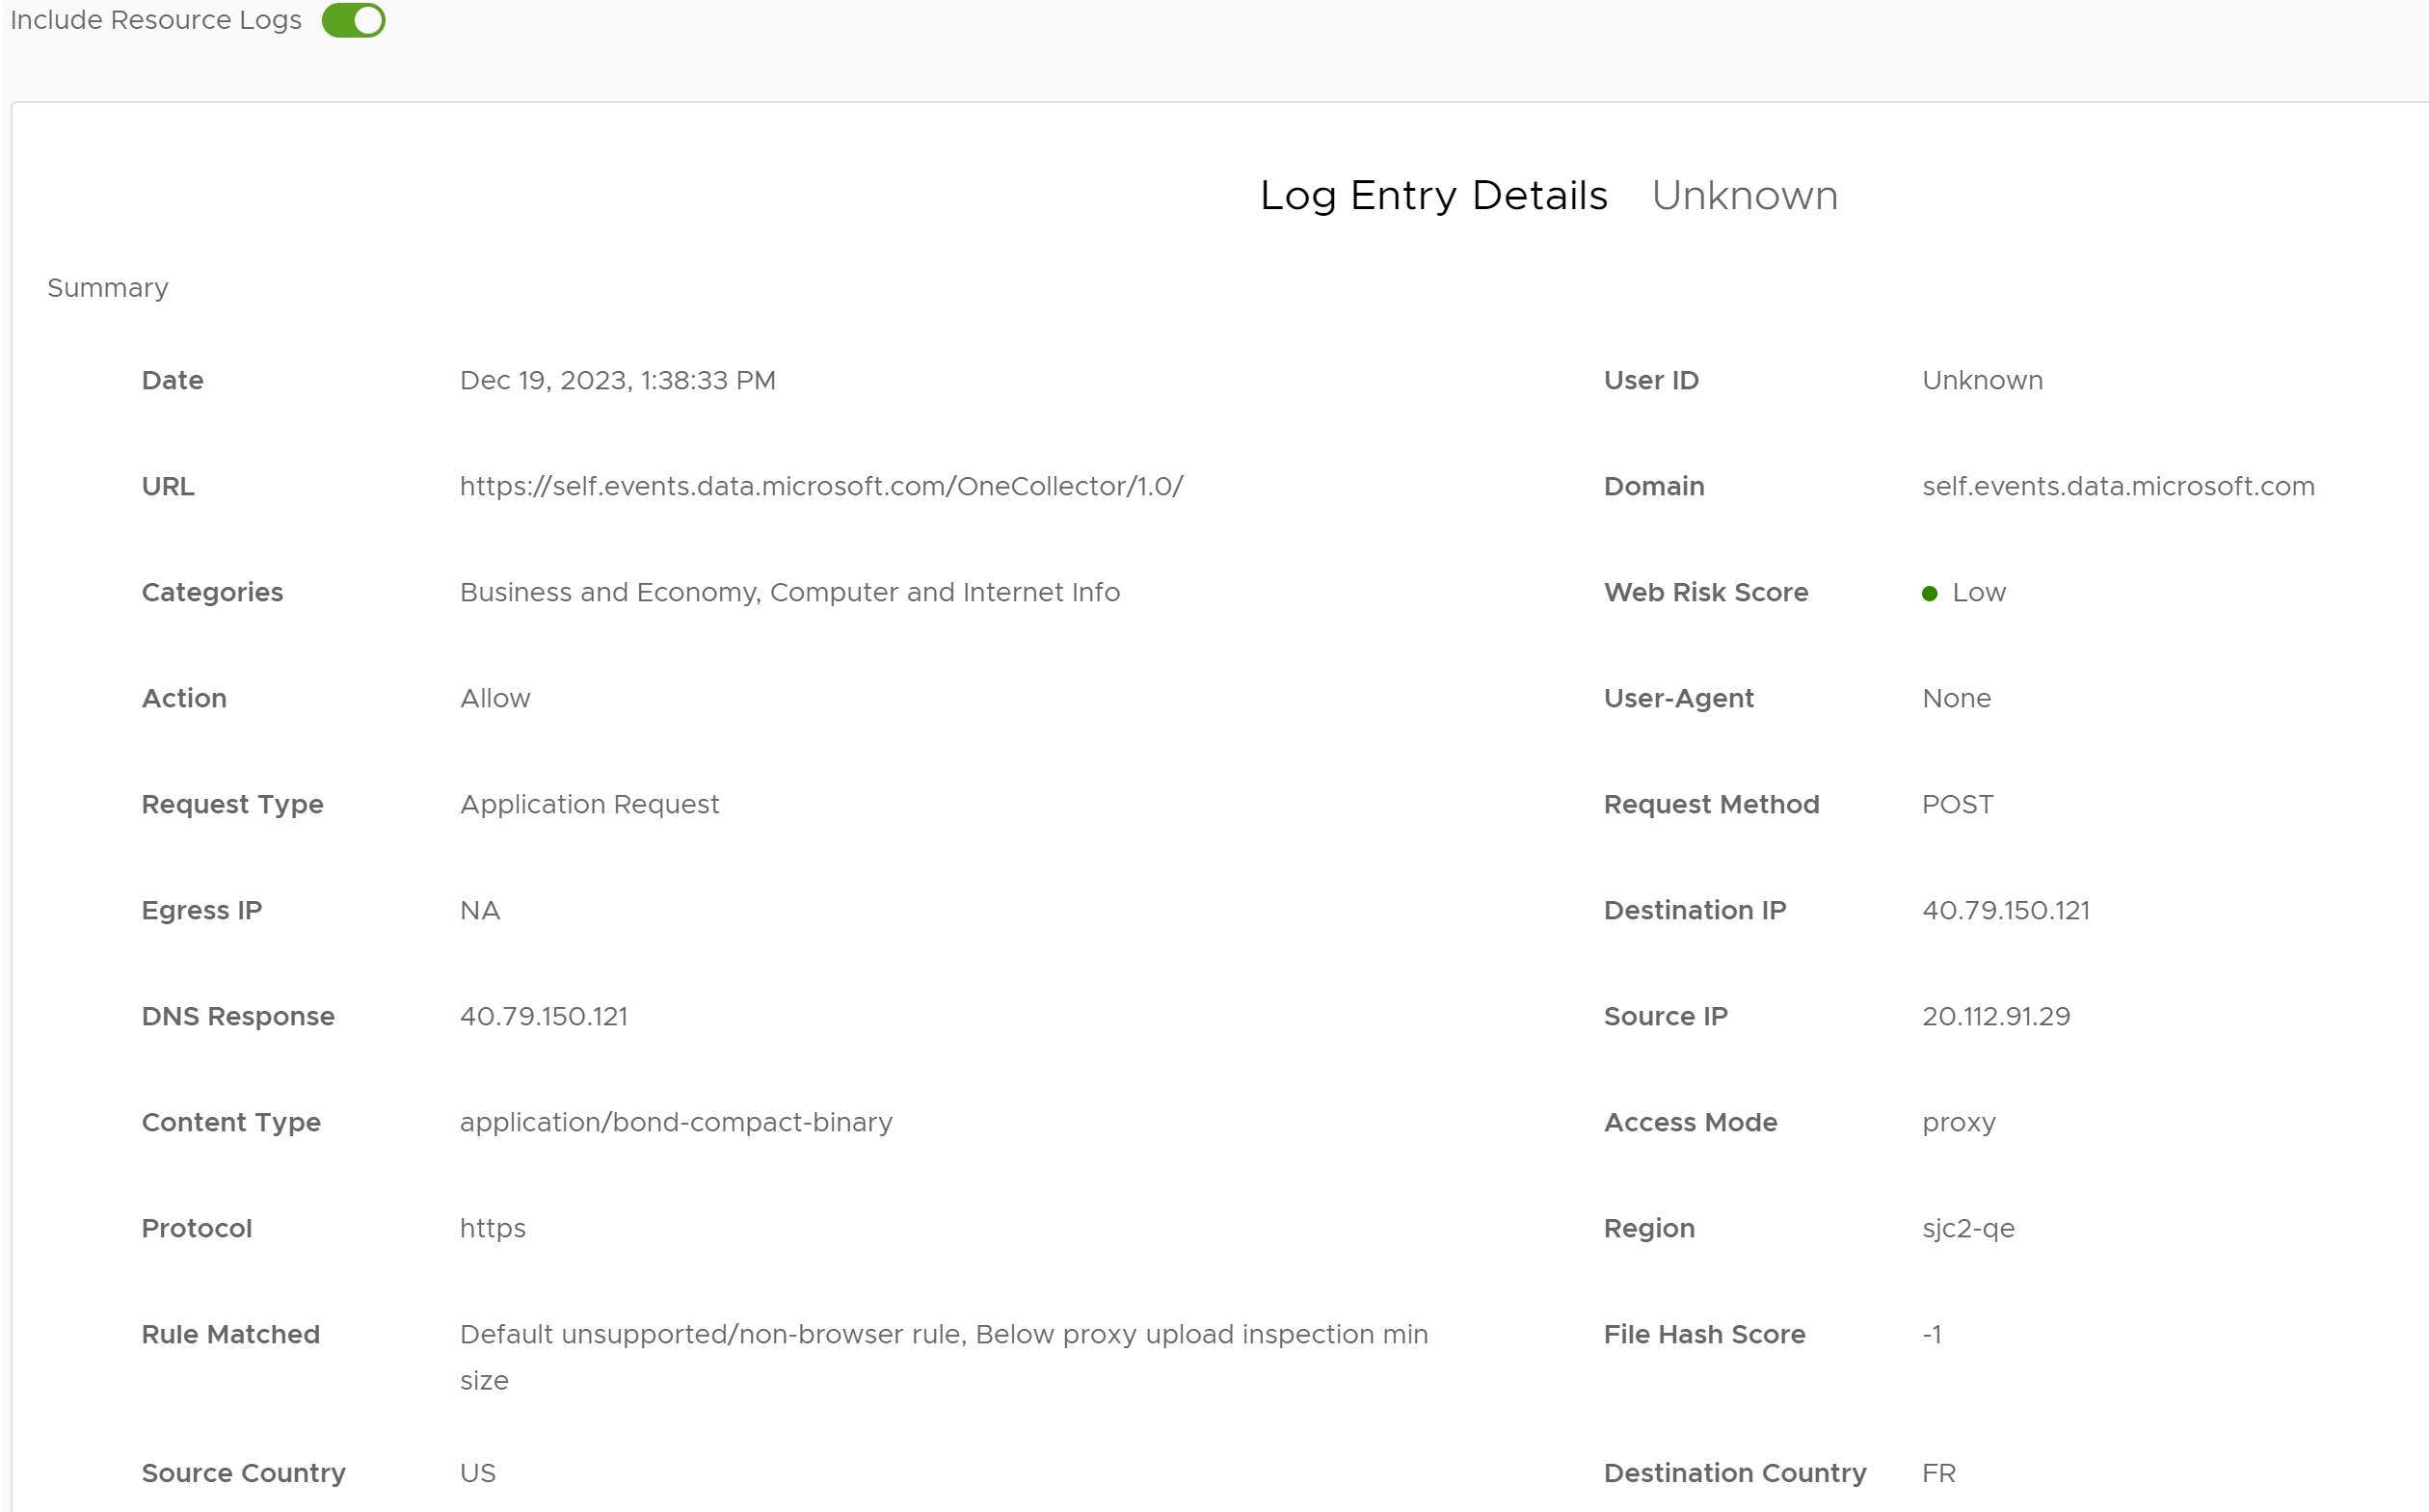
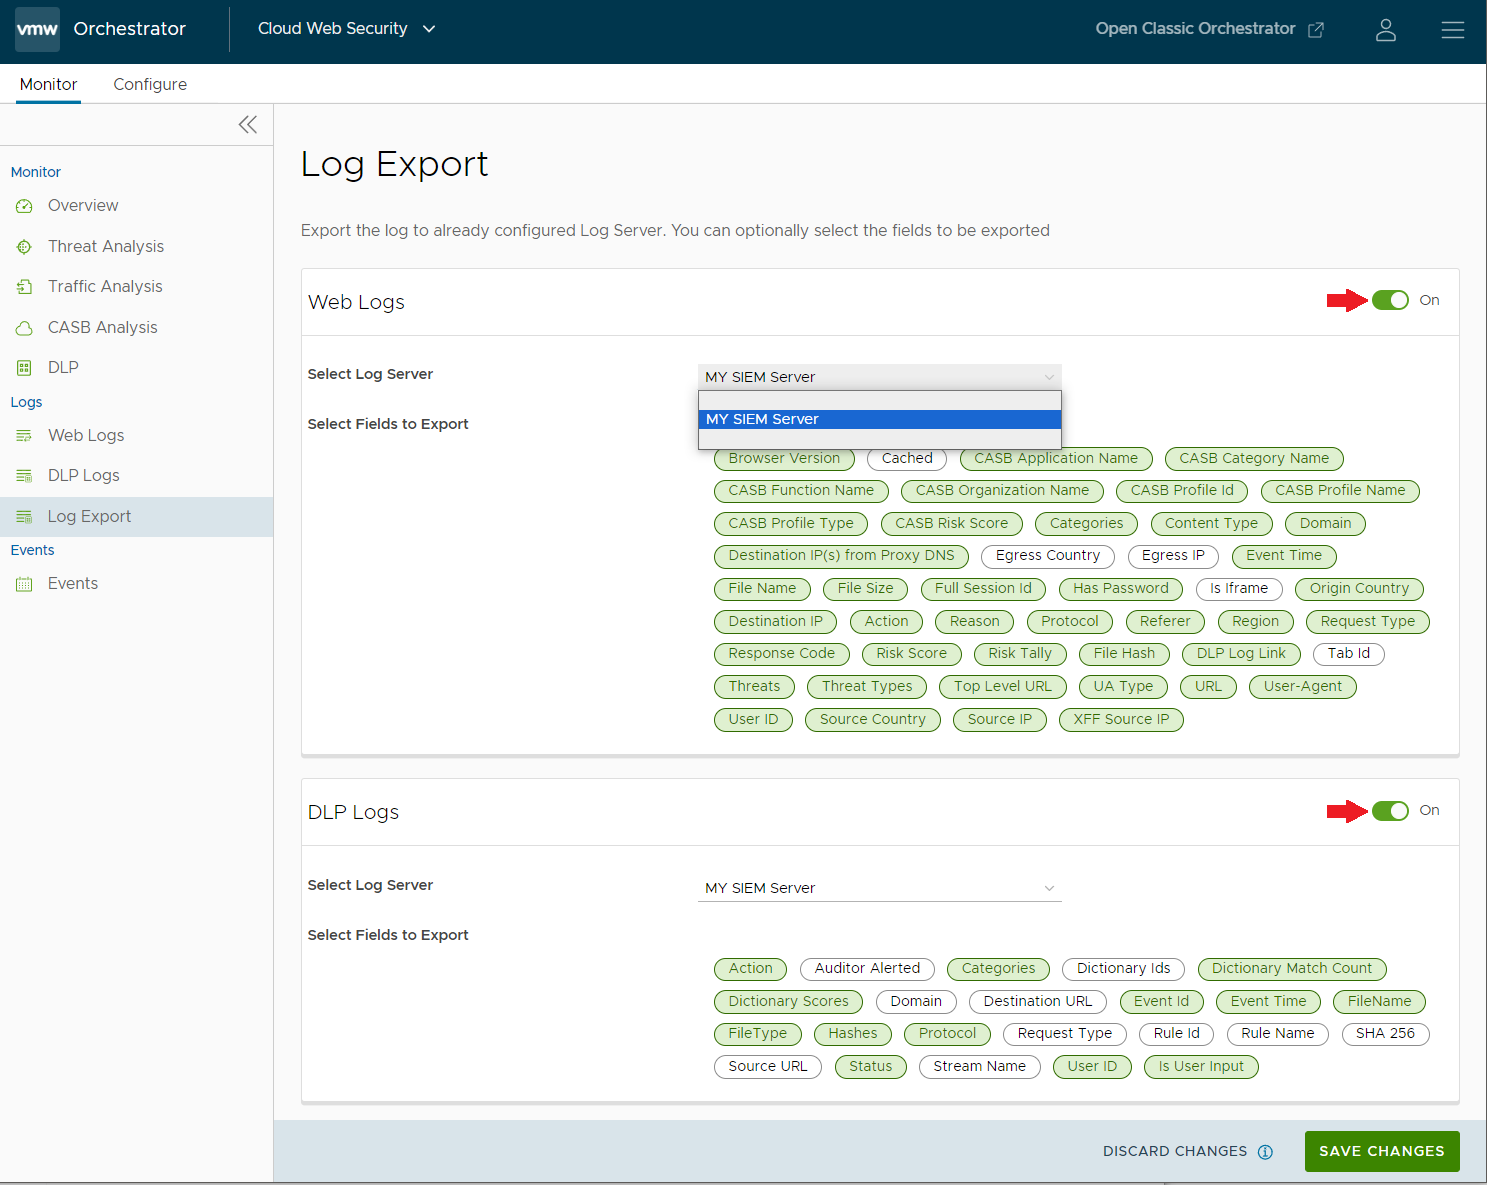
Web Logs
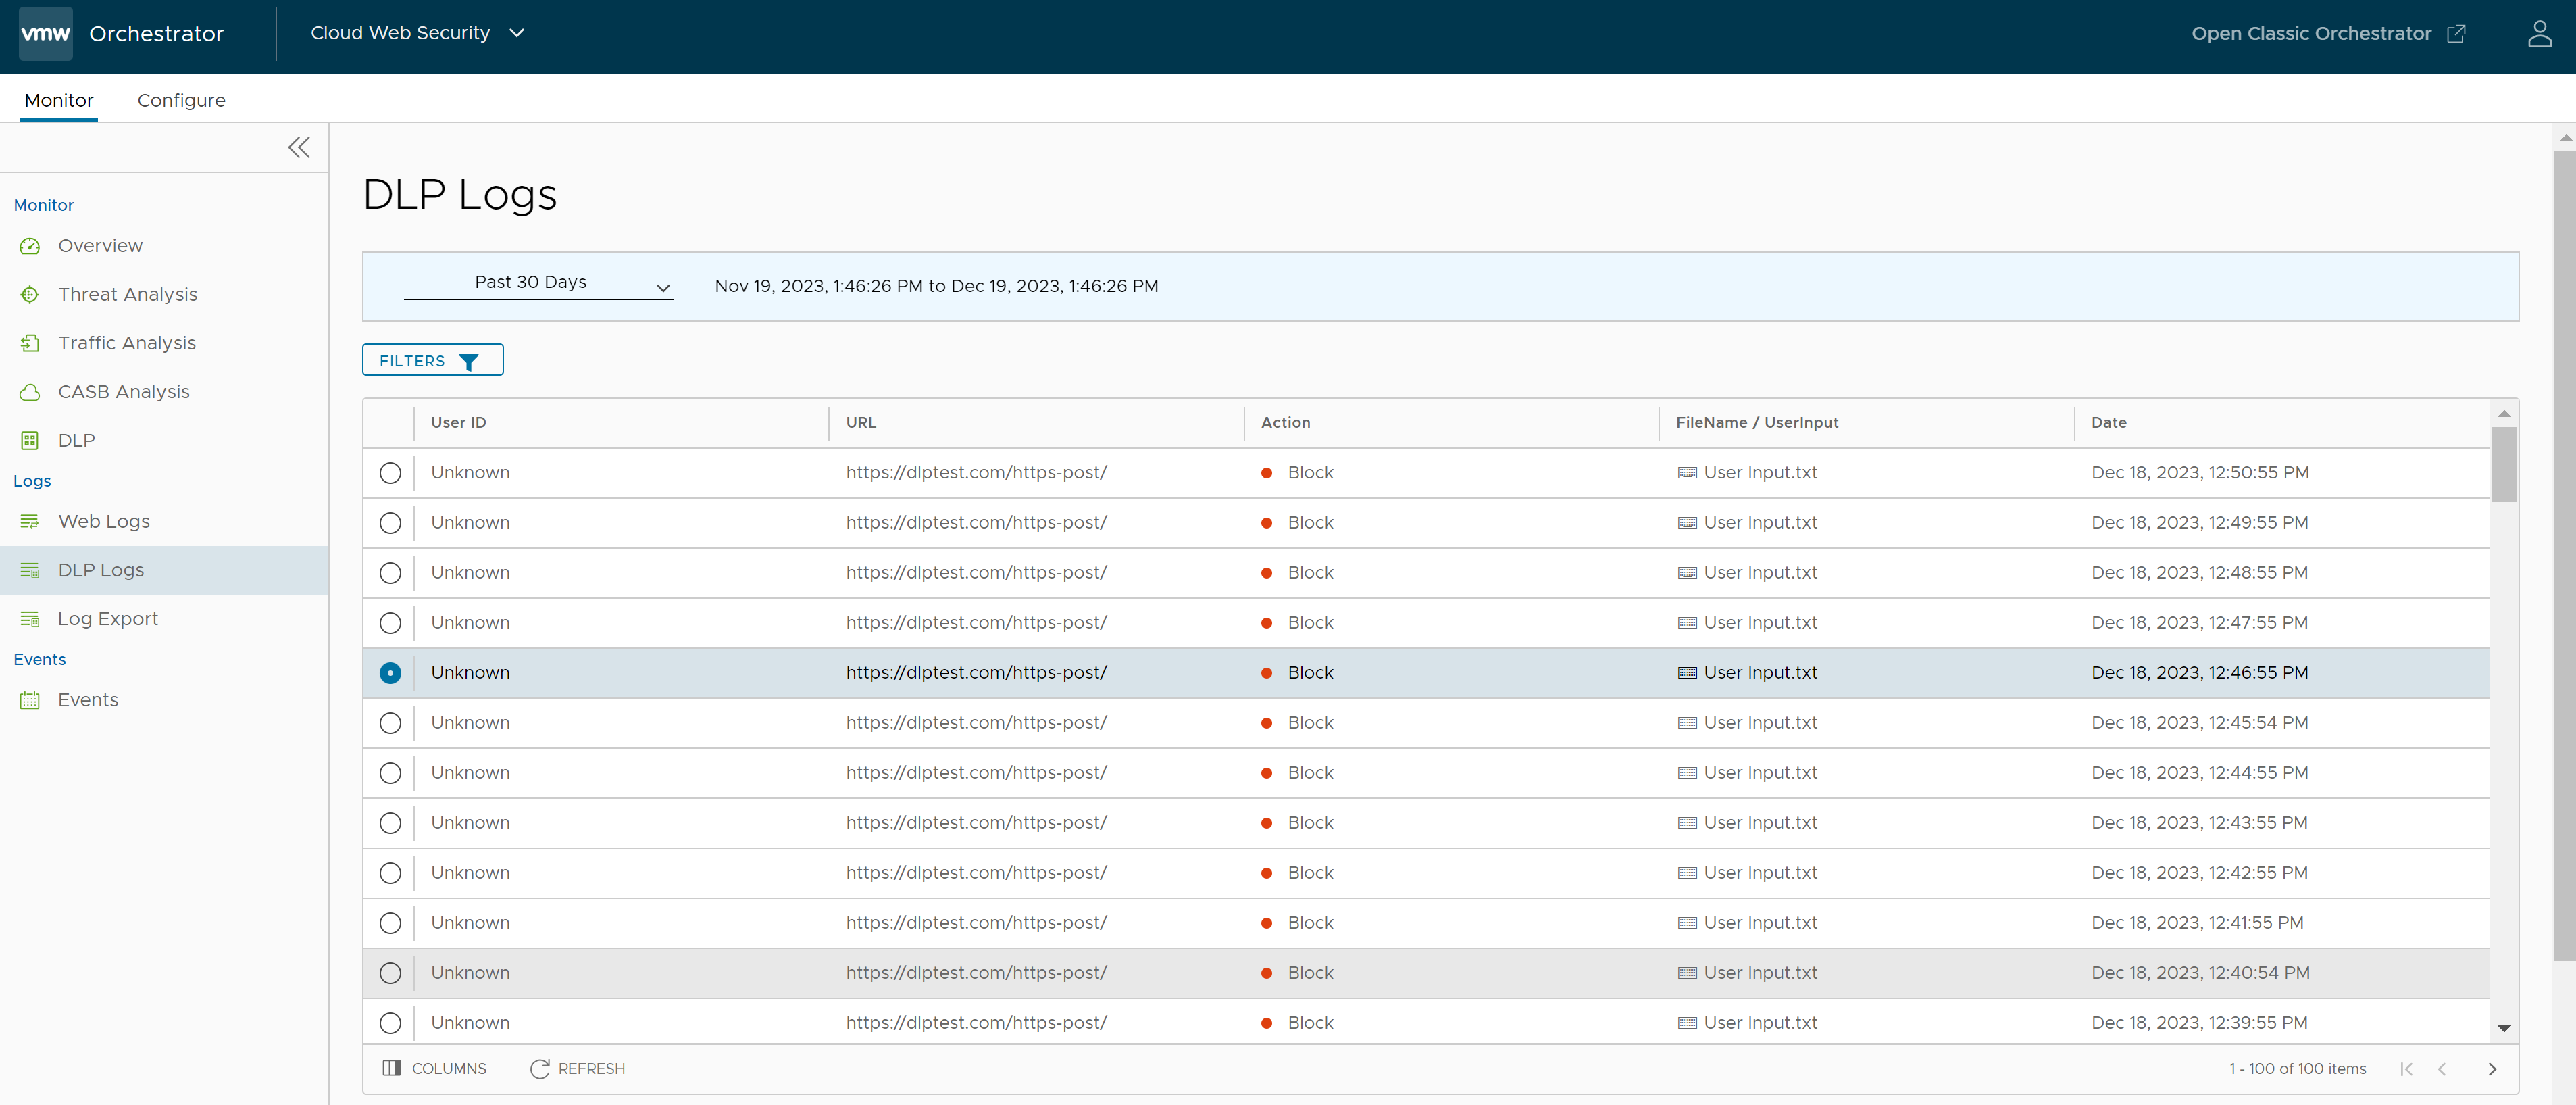
DLP Logs
Log Export
The Log Export feature enables a customer to forward near-realtime logs about Cloud Web Security activities to a customer-controlled SIEM (Security information and event management) endpoint for storage and analysis.
Events
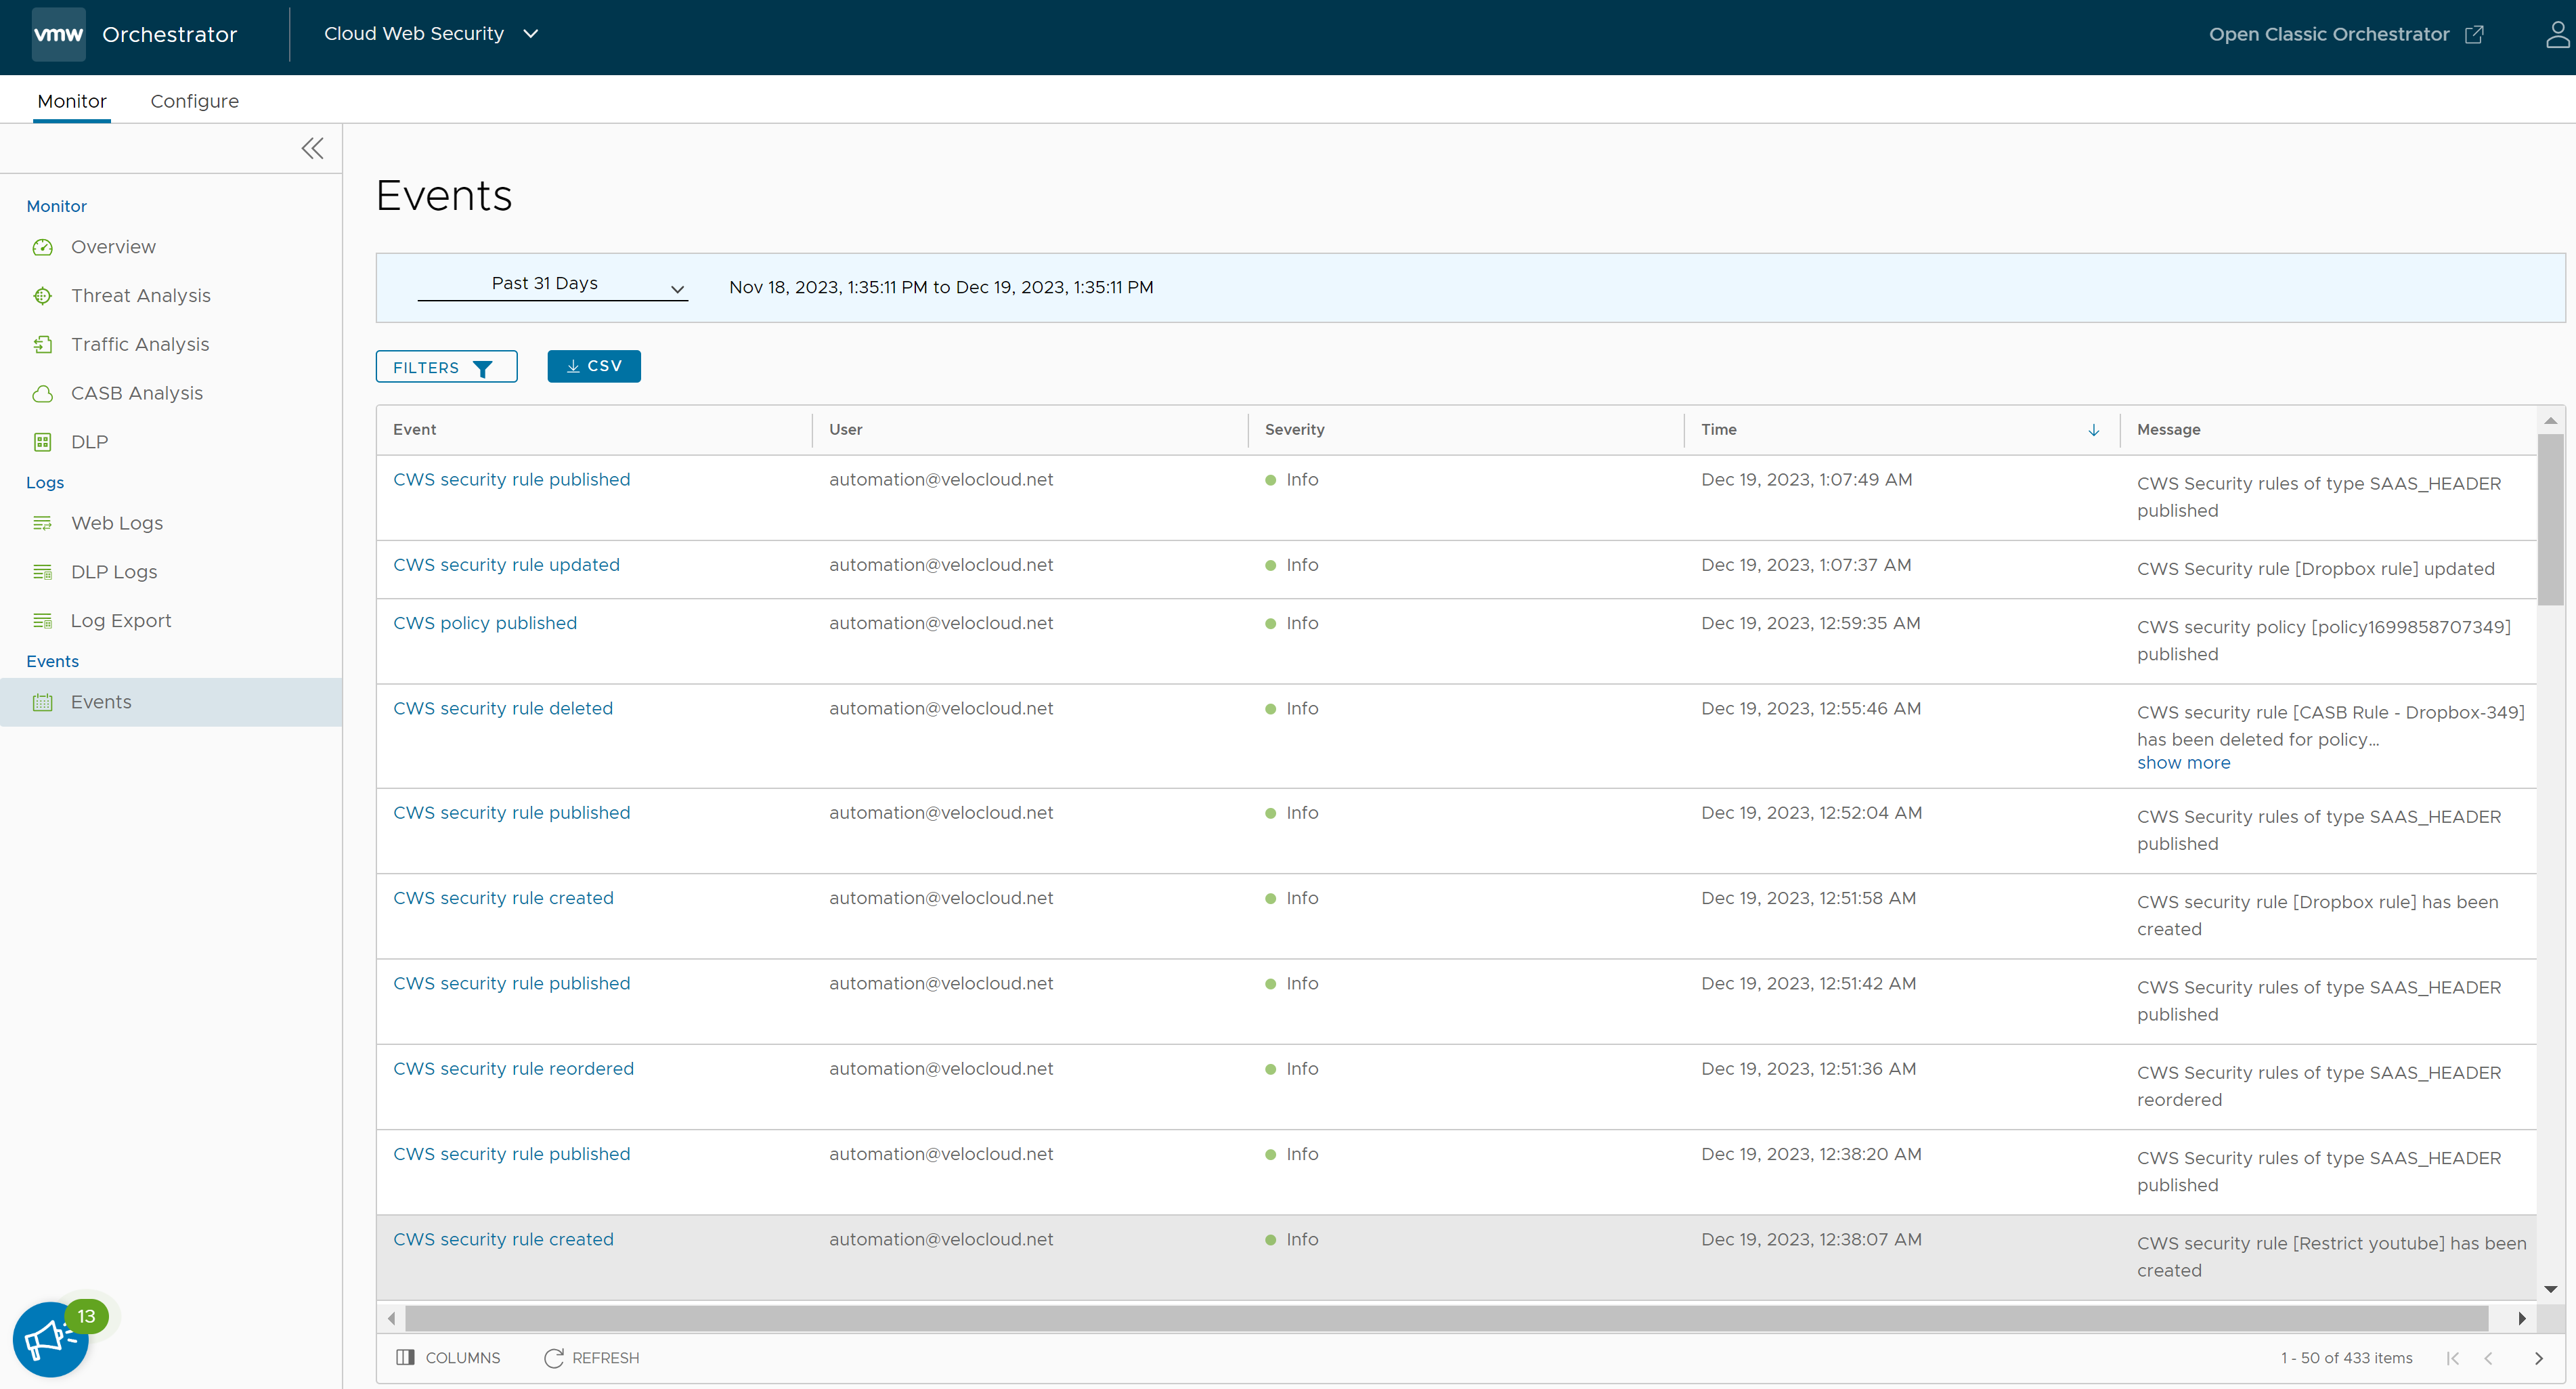
Users can choose a specific time period from the drop-down list, to view the events for the selected duration (for example, Past 31 Days).
To view details related to specific events, use the Filter optiona. Click the Filter button to filter the list of events based on the following options: Event, User, Severity, Event Detail, and Message.
Click the CSV button to download a report of the events in CSV format.
| Option | Description |
|---|---|
| Event | Name of the event. |
| User | Name of the user who performed the event action. |
| Severity | Severity of the event. The available options are Alert, Critical, Debug, Emergency, Error, Info, Notice, and Warning. |
| Time | Date and time of the event. |
| Message | A brief description of the event. |
