VMware Data Services Manager collects health and metric data for each database. As a vSphere administrator, you can use the vSphere Client to view this data and monitor the database status. You can also identify and review node VMs that back the database.
Procedure
- In the vSphere Client, navigate to the vCenter Server instance where the DSM plugin is registered, click the Monitor tab, and click Databases under Data Services Manager.
This action displays the
Databases view, a table that lists the provisioned databases.
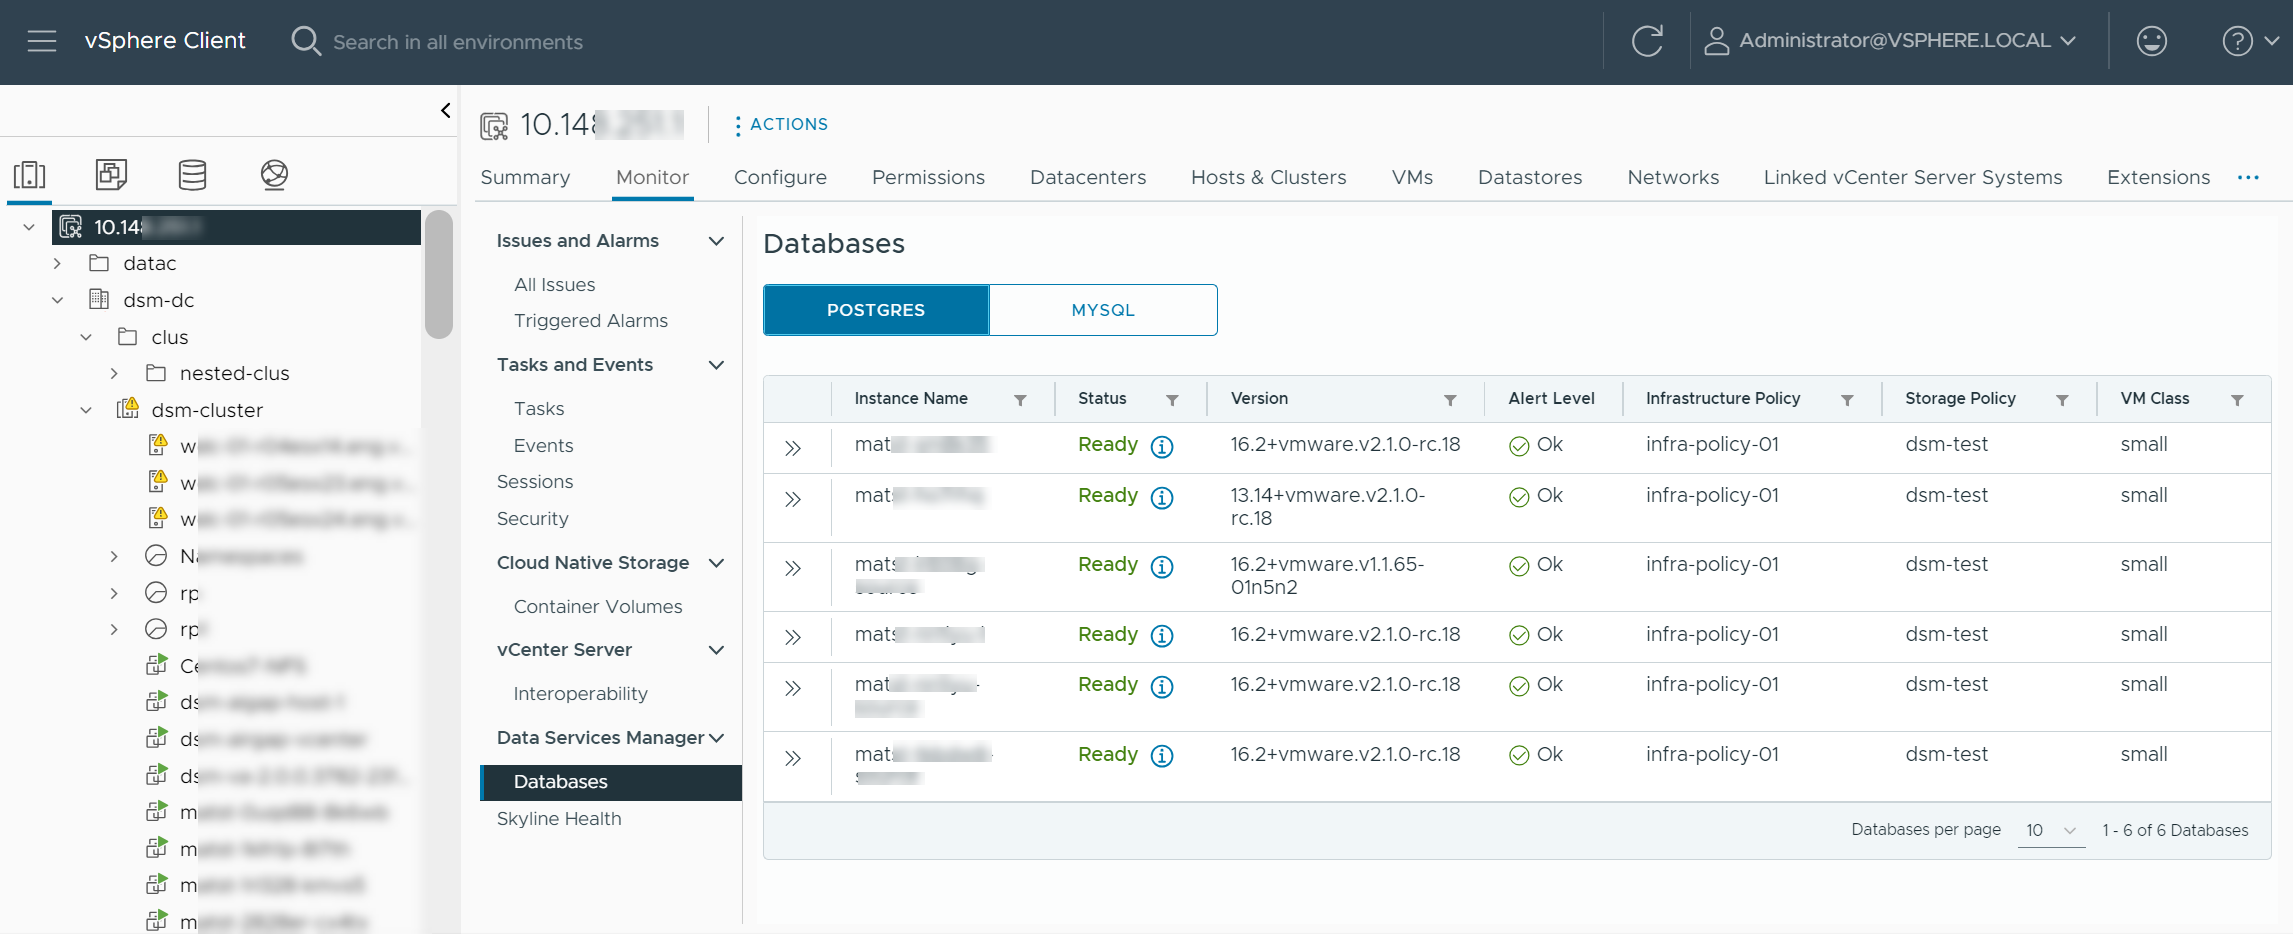
- Examine the databases listed in the table.
You can review the database statuses.
VMware Data Services Manager uses the database status to reflect the availability of the database, and in some cases, to identify an in-progress operation or a critical operation that failed. The status of a database is also affected by alerts that
VMware Data Services Manager might trigger on the database.
The table also displays infrastructure policies, storage policies, and VM classes assigned to the databases.
- Identify the database of interest, and click the arrow icon next to the database to expand its view.
The view shows database node VMs that back up the database and their roles, such as primary, monitor, or replica.
You can also review the following metrics:
- CPU Utilization % - The ratio of used to allocated CPU.
- Memory Utilization % - The ratio of used to allocated memory.
- Data Disk Utilization % - The ratio of used to allocated disk.
- Click the link next to the specific node VM to navigate to the VM Monitor view.
Use the view to review additional details and metrics relevant to the VM and database activities in the
VMware Data Services Manager environment.


