Aria Operations is a single instance of a multi-node analytics cluster which is deployed in the central datacenter. The Aria Operations cluster consists of different types of Analytics Node which include a Primary Node, a Primary replica node and a max of 16 Analytics Data nodes.
Aria Operations Cluster
Primary Node : This node serves as the central administrator for the cluster, overseeing its management and operation. It is self-managed, equipped with necessary adapters, and handles all tasks related to data collection and analysis within the cluster.
Primary Replica Node: It is a backup of primary node, which provides admin responsibilities in case of primary Node failure.
Data Node: These nodes have adapters installed and perform collection and analysis and help in scaling the cluster.
Witness node : When connection between a fault domain dies the witness node helps in decision making about availability of Aria Operations cluster.
Cloud Proxy – Cloud Proxy replaces the old Remote collector and does the function of both collecting inventory objects and app specific objects. Unlike Remote collector, Cloud proxy only opens a one way connection to the Aria Operation Cluster Size your VMware Aria Operations Analytics cluster instance to ensure performance and support. For more information about sizing, see the Sizing Guidelines KB 2093783.
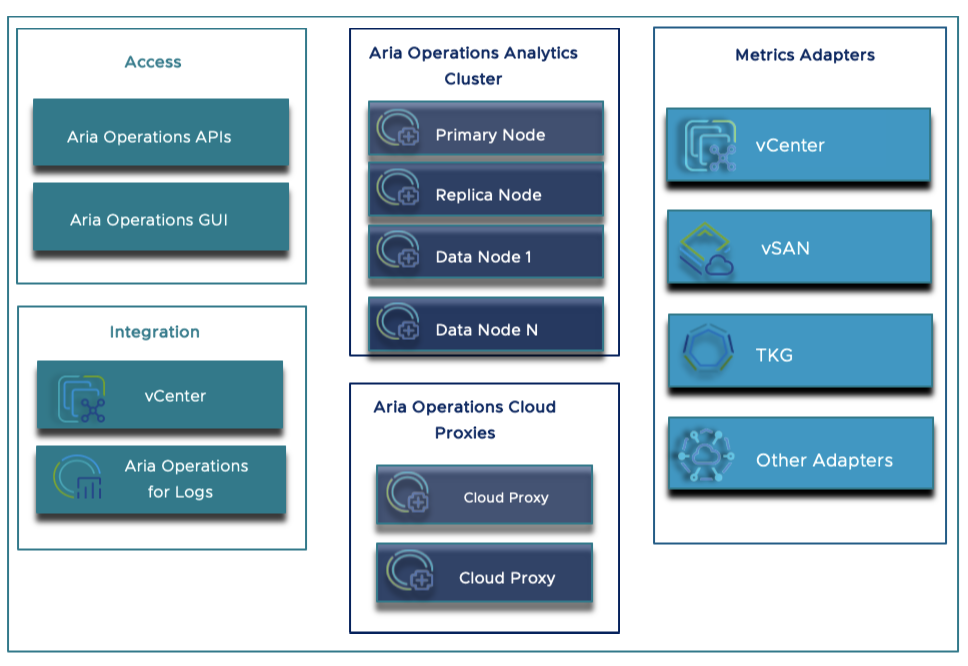
The image above provides a comprehensive overview of the various components within Aria Operations. It highlights different types of nodes, adapters, and integration points, offering insight into the intricate workings of the system.
Administration
Integration of Data Source with Aria Operations
Aria Operations offers seamless integration with diverse data sources, enabling effective monitoring of various infrastructures and appliances. It can be seamlessly integrated with vCenters, Tanzu Kubernetes Grid, Aria Operations for Logs, and more. Additionally, Aria Operations extends its monitoring capabilities to include metrics gathered from Cloud Proxies deployed in remote locations, providing a comprehensive view of the entire infrastructure. This holistic approach facilitates operations monitoring and empowers users to create customized dashboards and reports.
Cloud Accounts - You can configure cloud adapter instances and collect data from cloud solutions that are already installed in your cloud environment from the cloud accounts page.
Other Accounts - You can view and configure native management packs and other solutions that are already installed and configure adapter instances from the other accounts page.
Repository - You can activate or deactivate native management packs and add or upgrade other management packs from the Repository page.
Furthermore, Aria Operations can enhance its monitoring capabilities by installing and configuring management packs to connect with and analyze data from external sources within your environment. Once connected, Aria Operations enables the monitoring and management of objects across your environment, ensuring efficient operational oversight.
Aria Operations Object discovery
Objects are the structural components of your mission-critical IT applications: virtual machines, datastores, virtual switches and port groups are examples of objects. VMware Aria Operations collects data and metrics from objects using adapters, that are the central components of management packs. When you create a new adapter instance, it begins discovering and collecting data from the objects designated by the adapter, and notes the relationships between them.
VMware Aria Operations gives you visibility into objects including applications, storage and networks across physical, virtual and cloud infrastructures through a single interface that relates performance information to positive or negative events in the environment. Few Example would be vCenter Server, Virtual machines, Servers/hosts ,Compute resources, Storage components etc
Aria Operations application monitor
Aria ops can manage remote applications by collecting the metrics from Kubernetes specific management packs.This includes auto-discovery of new object types, such as Clusters, Namespaces, Pods and Tanzu Kubernetes clusters.This is natively built into the vCenter adapter in Aria Operations, so there is nothing you need to do other than configure the adapter as you normally would.
The integration allows virtual administrators to manage capacity and performance of Kubernetes infrastructure alongside the traditional virtual infrastructure. This way, they can provide support for modern applications by reducing complexity of managing Kubernetes and expanding operational visibility to containers. Aria Operations also supports Application Discovery by which, Applications can also be discovered on a VM with services connected to each other and those that talk to each other. You can discover predefined and custom applications.
Alerts and Actions
Effective monitoring aims to detect potential issues well in advance, ensuring swift resolution and maintaining optimal performance across the entire operational spectrum. Failing to address critical scenarios promptly can pose significant risks to overall operations. Aria Operations offers the capability to establish alerts and define actions, enabling early detection and remediation of any potential issues.
Alerts are a way to be watchful of anything that is new or an issue that could be potentially dangerous to your environment. Whenever there is a problem in the environment, the alerts are generated. You can also create new alert definitions so that the generated alerts inform you about the problems in the monitored environment.
Actions allow you to make changes to the objects in your environment. When you grant a user access to actions in VMware Aria Operations, that user can take the granted action on any object that VMware Aria Operations manages.
In VMware Aria Operations, alerts and actions play key roles in monitoring the objects. The update actions modify the target objects. For example, you can configure an alert definition to notify you when a virtual machine is experiencing memory issues. Add an action in the recommendations that runs the Set Memory for Virtual Machine action. This action increases the memory and resolves the likely cause of the alert. To view more on creating a simple alert refer to simple alert.
Dashboards
Aria Operations includes a broad set of simple to use, but customizable dashboards to get you started with monitoring your VMware environment. The predefined dashboards address several key questions including how you can troubleshoot your VMs, the workload distribution of your hosts, clusters, and datastores, the capacity of your datacenter, and information about the VMs.
For Edge use case :
Dashboard provided by vCenter
Dashboard provided by Kubernetes or Tanzu Kubernetes Grid.
Dashboard for vSAN
Dashboard for Service and Application Discovery
Dashboard provided by hardware vendors like Dell etc
Monitoring with Edge Personas
Sr.No |
Persona |
Responsibilites |
|---|---|---|
1 |
Edge Infrastructure admin |
This persona would be responsible for managing and configuring the infrastructure at the edge sites within Aria Operations |
2 |
Edge Site Worker |
Can Monitor alerts , create dashboards and reports within Aria Operations to gain insights into the health and performance of edge infrastructure assisting troubleshooting and maintenance. |
3 |
Application Owner |
The Application Owner would leverage Aria Operations to monitor the performance and availability of applications deployed at the edge. |
4 |
Network Team |
This persona can consume Aria Operations to visualize network topology, analyze traffic patterns, and troubleshoot connectivity issues across edge sites. |
5 |
Operations technology |
Can ensure the availability and Monitor various sensors and edge applications |
6 |
Security Team |
Can monitor and analyze security alerts generated by edge devices and applications |
The above personas do not directly correspond to the default roles and permissions in Aria Ops. However, Aria Operations offers numerous methods to create and map roles to different personas in a highly granular manner; more on this can be found here Aria roles.
Design Considerations for Edge Monitoring with Aria Operations
Design Parameters:
Aria Operations Cluster requires that the latency between analytics nodes should not exceed 5 milliseconds.
Network Bandwidth between the analytics cluster nodes must be one gbps or higher.
Network Latency between agents running on the endpoint to collector should not exceed 20 milliseconds.
Architecture
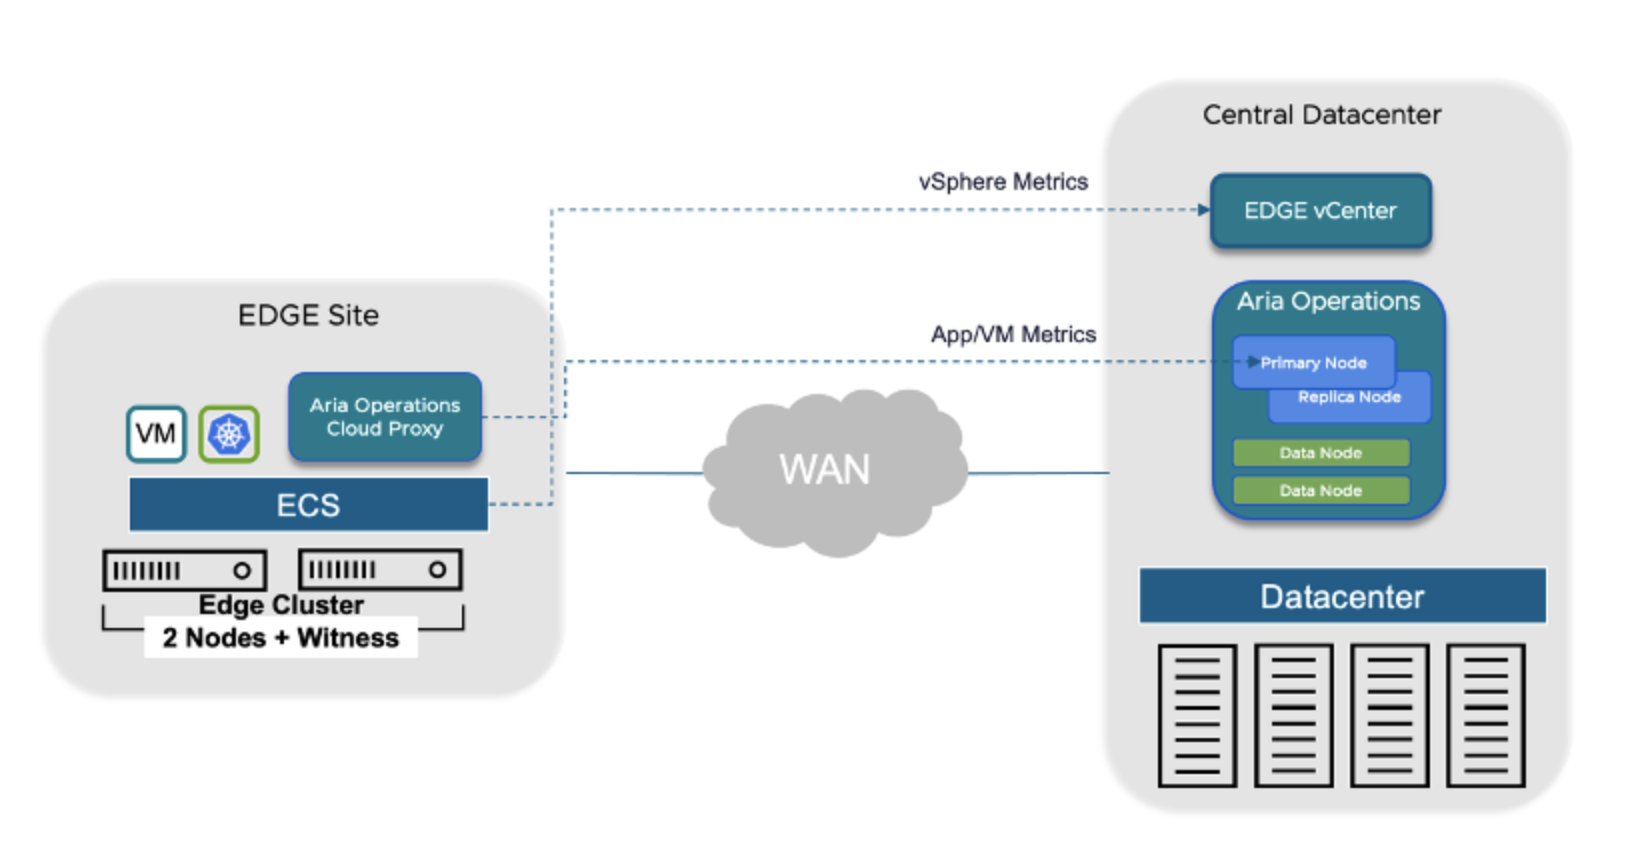
The challenges mentioned above can be resolved by introducing Aria Operations Cloud Proxy. We can use cloud proxies in VMware Aria Operations to collect and monitor data from your on-premises datacenter across different geo locations.
Cloud Proxy
As discussed in the design parameters the mentioned challenges can be effectively addressed by deploying the Aria Operations Cloud Proxy in proximity to the Edge Site. It is capable of managing network latency up to 500 milliseconds, with network bandwidth requirements ranging from 25 to 60 Mbps, depending on the deployment type.
Using cloud proxies in VMware Aria Operations, you can collect and monitor data from your remote data centres. You can deploy one or more cloud proxies in VMware Aria Operations to create a one-way communication between your remote environment and VMware Aria Operations. The cloud proxies work as one-way remote collectors and upload data from the remote environment to VMware Aria Operations
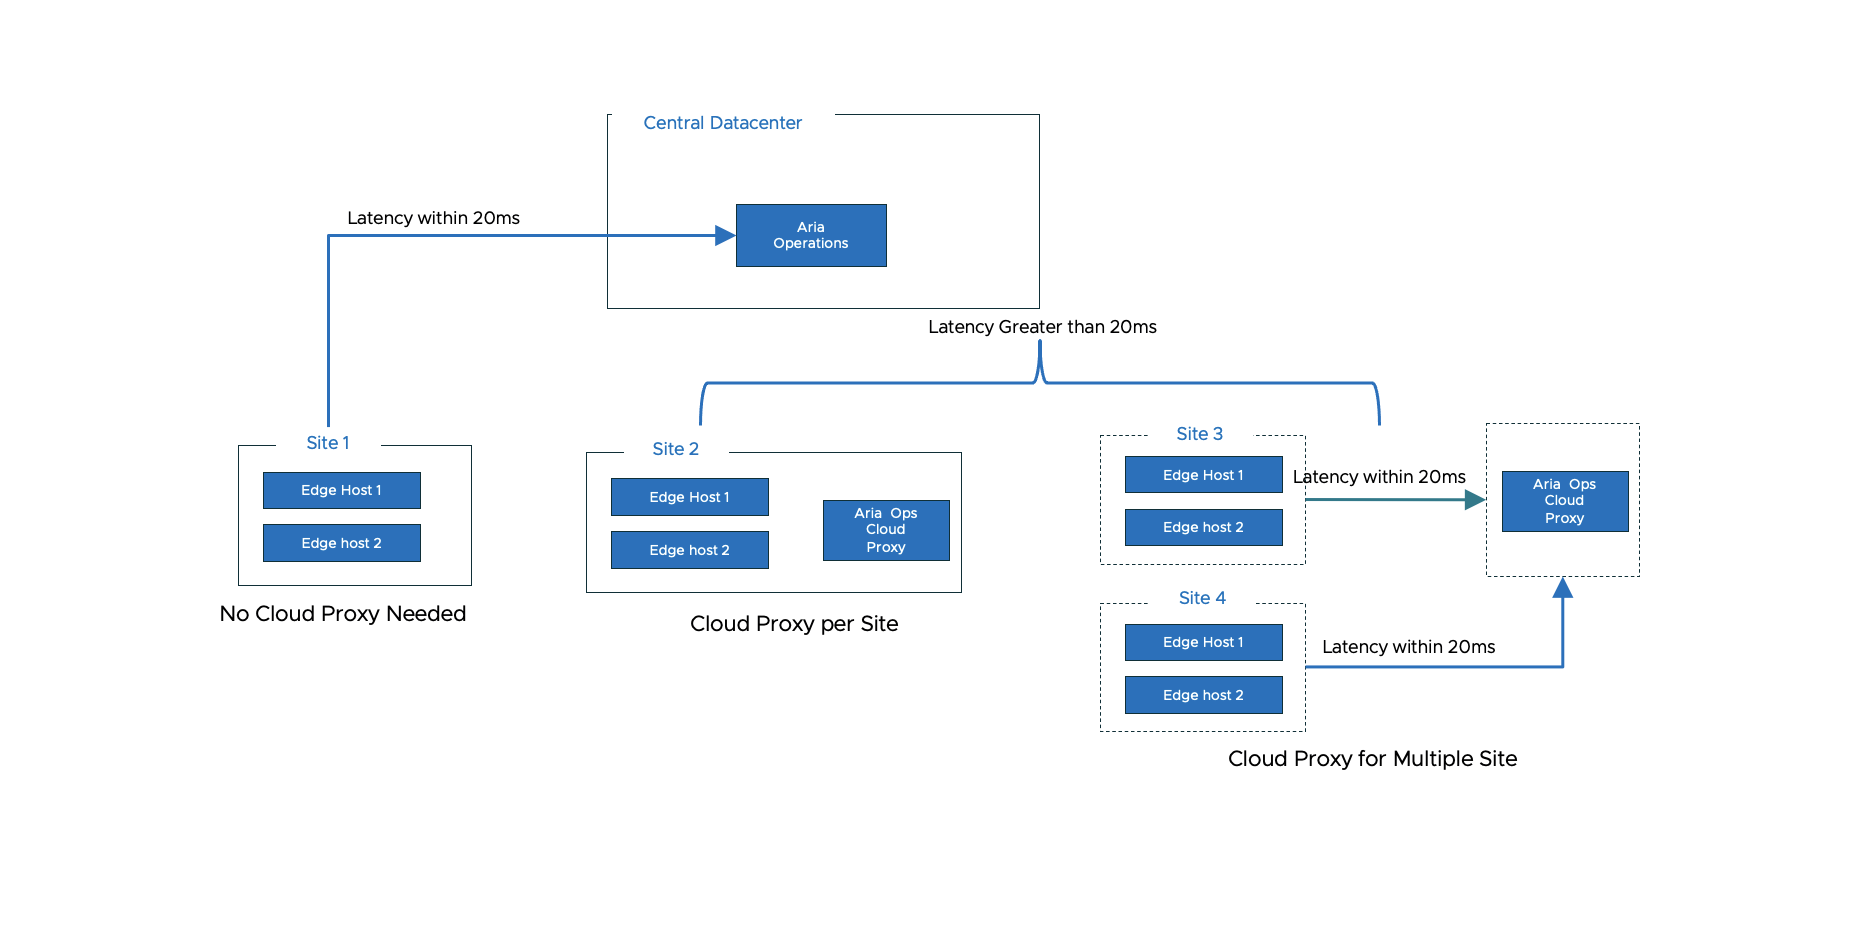
Placement of Cloud Proxy
A Cloud Proxy can be deployed in various scenarios outlined in the image below. It becomes necessary when the latency exceeds 20ms between Datacenter Aria Operations and the Edge Location. Moreover, a single cloud proxy can serve multiple sites if the latency comfortably remains within the 20ms limit. Conversely, deploying a cloud proxy is unnecessary if the latency between the edge and datacenter is less than 20ms.
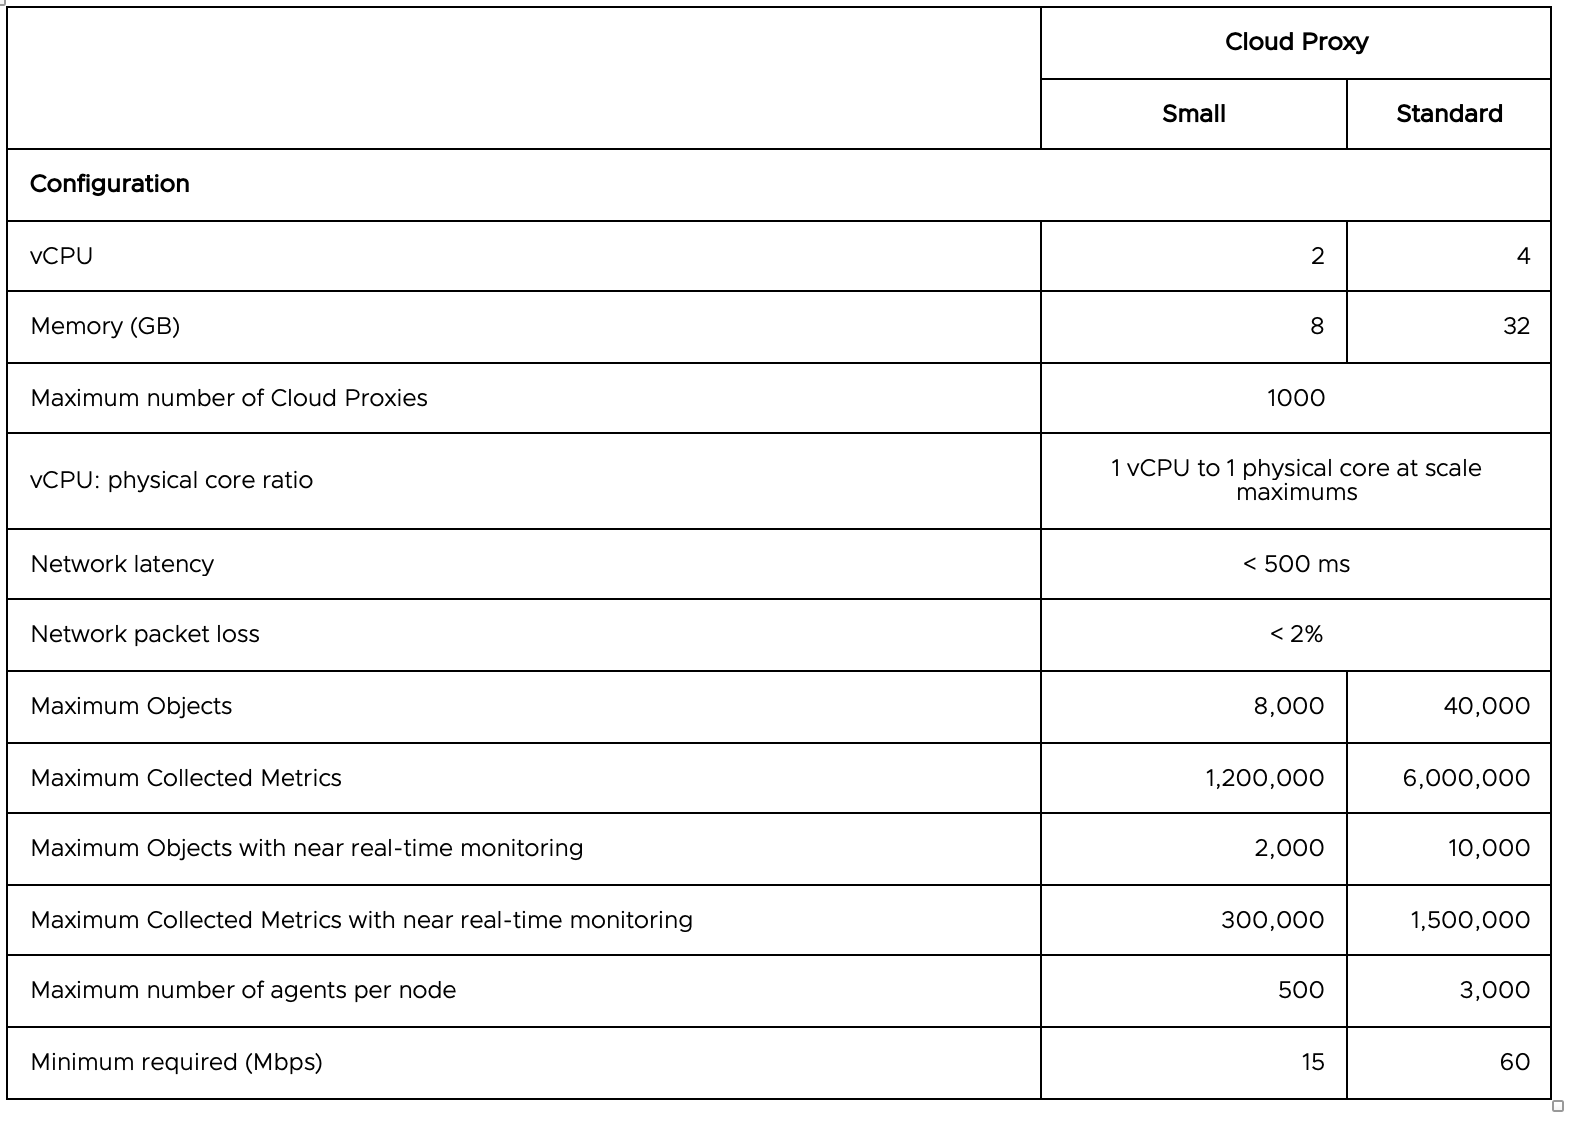
Sizing of Cloud Proxy
Determining the appropriate sizing for the cloud proxy is crucial as it provides insight into the required resources or potential additional resources needed. The table below outlines various configuration parameters for Small and Standard Cloud Proxy Deployments, available in two different sizes. Further details can be found in KB 78491. Both the preset size require a ~84.0 GB (Thick) disk size. Choosing between these two sizes should keep capacity calculation provided below into considerations.
ID |
Design Decision |
Design Justification |
Design Implication |
|---|---|---|---|
1 |
No Cloud Proxy needed When the Latency between Edge Site and Central Site is within 20ms |
Within 20 ms Apps and Endpoints can directly configure the metrics to be sent on the central site |
There will be no Data handling in case of WAN outage. |
2 |
Use a small preset of cloud proxy on edge cluster |
Cloud Proxy is required to collect the Metrics and forward it to the central datacenter. Small preset can handle up to 8000 VM, 8000 Object and up to 1,200,000 metrics, |
Cloud Proxy will consume additional space on edge clusters with a minimum of 2 vCPU and 8 GB RAM and disk size of 84 GB minimum. |
3 |
Sites running critical Apps requiring Realtime always-on monitoring should have Cloud Proxy deployed in a HA Manner in a cluster |
Clustered cloud proxy deployment will make sure if one cp goes down other will keep on sending the metrics |
Extra resource consumption on Edge |
Networking Requirements
Firewall and Ports
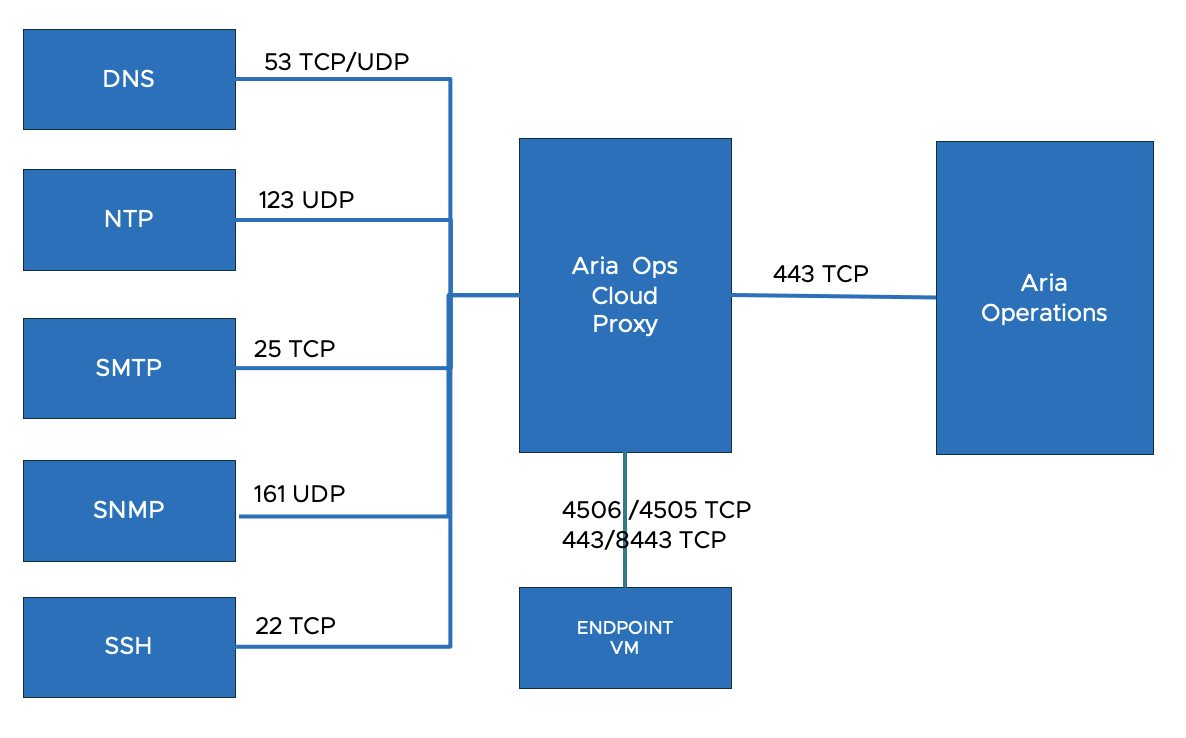
Allow outgoing HTTPS traffic for cloud proxy over port 443.
Allow incoming traffic to cloud proxy over ports 443, 8443, 4505, and 4506 for telegraf based application monitoring.
Allow incoming traffic to cloud proxy over port 443 for push model adapters on cloud proxy.
Using a firewall to restrict traffic by IP is not recommended since IPs can change without notice. Restricting traffic must be performed via FQDNs only.
In addition to these requirements, it's essential to ensure that the ports required by the adapters are opened according to the specifications outlined in the adapter prerequisites.
The image below also illustrates connections with other Network Management Protocols, should they be utilized.
ID |
Design Decision |
Design Justification |
Design Implication |
|---|---|---|---|
4 |
Configure time synchronization by using an internal NTP time for the Edge Cluster and CP |
Prevents from failures in the deployment and keep the Metrics Synced |
An operational NTP service must be available to the environment. All firewalls located must allow NTP traffic on the required network ports. |
5 |
Configure DNS by using internal DNS Server |
Informs emergency scenarios which helps in timely resolution |
Internal DNS server is required and the port 53 TCP/UDP should be allowed on the firewall |
Metrics, Adapters and Metric Flow
Metrics are quantitative data points that provide insights into the performance, health, and utilization of resources within an IT environment. These metrics are collected and analysed by monitoring tools.
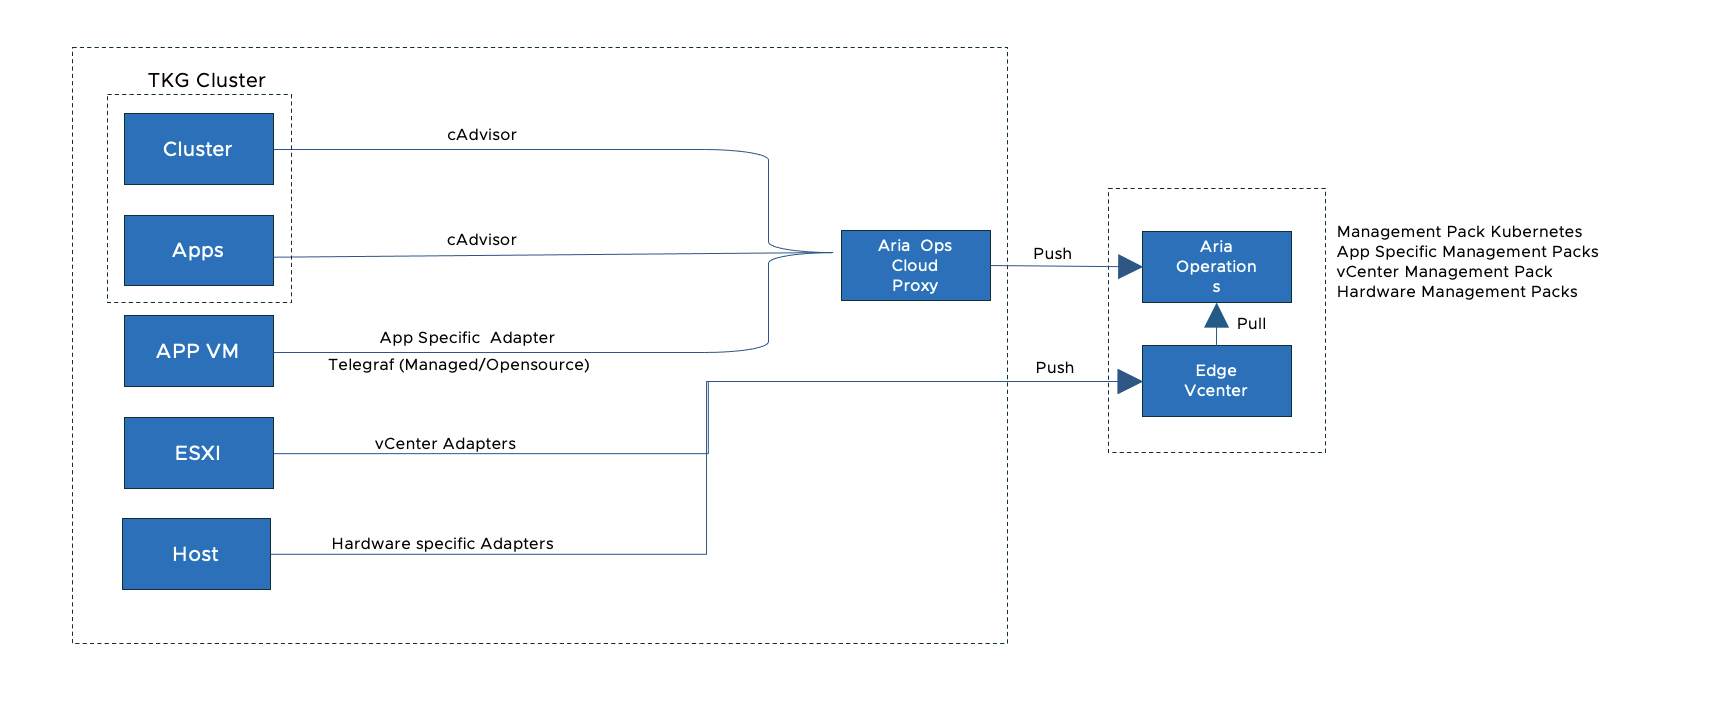
Metrics within the Edge Cluster are produced through standard Adapters, which then transmit these metrics to Aria Operations via Aria Operation Cloud Proxy and vCenter. These adapters are bundled in a Management pack. Management packs extend Aria Operations’ capabilities by providing specialized view and dashboards for monitoring and management features for specific applications, leveraging the data collected by adapters. The VMware Marketplace offers a variety of Management Packs to choose from based on specific requirements and needs.
The image below provides insight into various types of adapters, encompassing hosts, VMs, and various types of applications. It also shows the flow of metric from edge to central site. Host and ESXI metrics are integrated with vCenter while other app and cluster logs are forwarded via cloud proxy to Aria Operations cluster.
Adapters are software components or plugins that facilitate the integration of Aria Operations with external systems, devices, and applications to collect metrics and monitor their performance. These adapters enable organizations to collect, analyse, and visualize metrics from diverse sources
VMware Adapters: These adapters collect metrics from VMware vSphere, vCenter Server, vSAN, and other VMware products.
Third-party Adapters: Aria Operations offers adapters for integrating with third-party vendors and technologies, such as storage arrays, databases, operating systems, and applications etc.
Custom Adapters: Organizations can develop custom adapters to extend monitoring capabilities.
TKG Monitoring : Aria Ops Management Pack for Kubernetes onboards Tanzu and Kubernetes clusters seamlessly into Aria Operations expanding Aria monitoring, troubleshooting and capacity planning capabilities to Tanzu and Kubernetes deployments. “Management Pack for Kubernetes” is an Aria Operations offering to monitor, troubleshoot, and optimize the capacity management for Kubernetes clusters. Some of the additional capabilities of this management pack are listed here.
Auto discovery for Tanzu Kubernetes Grid clusters,
Complete visualization of Kubernetes cluster topology, including namespaces, clusters, replica sets, nodes, pods, and containers.
Performance monitoring for Kubernetes clusters.
Out-of-the-box dashboards for Kubernetes constructs, which include inventory and configuration.
Multiple alerts to monitor the Kubernetes clusters.
Mapping Kubernetes nodes with virtual machine objects.
Report generation for capacity, configuration, and inventory metrics for clusters or pods.
Before you install Aria Operations Management Pack for Kubernetes, you must deploy the cAdvisor Daemon Set on the cluster. Container Advisor (cAdvisor) helps you in understanding the resource usage and performance characteristics of the running containers. The Container Advisor daemon collects, aggregates, processes, and exports information about running containers.
ID |
Design Decision |
Design Justification |
Design Implication |
|---|---|---|---|
6 |
Install these Management Packs on CP to start with - Management Pack for vCenter - Management Pack for Kubernetes - Management Pack for vSAN |
These Packs will provide some predefined UI and collectors to fetch the resource details |
None |
High Availability and Scalability
Cloud proxies provide high availability within your cloud environment,
Group two or more cloud proxies to form a collector group.
Provide a virtual IP for this collectors group, This virtual IP will automatically apply to the active cloud proxy.
The cloud proxy collector group ensures that there is no single point of failure in your cloud environment.
If one of the cloud proxies experiences a network interruption or becomes unavailable, the other cloud proxy from the collector group takes charge and ensures that there is no downtime.
Cloud Proxy can be scaled in various ways to accommodate increasing demands for data collection and processing. In scenarios where resource utilization surges due to high metric rates and other factors, VM scaling can be implemented based on the following criteria.
Scaling Vertically by Adding Resources: involves increasing the resources (CPU, memory, Storage and possibly network bandwidth) allocated to the existing Cloud Proxy instance
Scaling Horizontally (Adding nodes) : involves adding more Cloud Proxy nodes to the deployment to distribute the data collection and processing workload across multiple instances.
WAN Outage
From the perspective of edge monitoring and logging, a WAN outage leading to no communication with the central site can have several significant impacts:
Loss of Visibility
Delayed Detection of Issues
Inaccurate Performance Analysis
Data Loss and backlog accumulation
Data persistence
Data persistence is a configuration on cloud proxy which activates it to store data if the connection fails between the cloud proxy and Aria Operations. The cloud proxy stores all the data that is sent to Aria Operations.
For example, metrics, properties, and time stamps are all part of the persisted data that is stored in the cloud proxy.
Once the connection is restored, the cloud proxy sends the stored data to Aria Operations. The stored data is pushed to the cloud before the real-time data and the stored data is displayed before the real-time data is displayed.
In case of lack of space, you can add additional storage, for more information, see KB 2016022.
Time Estimation
Displays the estimated time duration for which the cloud proxy persists data. Cloud proxy can store data for a maximum duration of one hour. If there is a lack of space or if the connection fails for more than an hour, the cloud proxy rotates the stored data by deleting the oldest stored data and replacing it with the most recently collected data.
ID |
Design Decesion |
Design Justification |
Design Implication |
|---|---|---|---|
7 |
Enable Data Persistence Feature on Cloud proxy for Buffering and backup of Metrics |
This will buffer the Metrics for 1 Hour or till the disk size is full. |
This will consume the storage provided to the cloud proxy. In case of high IOPS if the disk size gets full it will drop the old metrics. |
Capacity Calculation
The capacity calculation primarily revolves around the quantity of metrics and objects being collected. This calculation holds significant importance as it aids in determining the appropriate sizing of nodes within the Aria Suite infrastructure.
Below, we provide an initial overview of the approximate number of metrics generated from specific objects, offering insights into the data volume and workload distribution within the system.
Capacity on Central Site:
The table below, along with the vropssizer tool, facilitates estimating the expected number of metrics from all edge sites.
By inputting the object list into the vropssizer tool, it can recommend whether additional data nodes need to be added to the Aria Operations analytics cluster.
Capacity on Edge Site:
Name |
Object |
Metrics |
|---|---|---|
vCenter |
1 |
95 |
ESXi |
1 |
146 |
VM |
1 |
103 |
Cluster |
1 |
185 |
Datacenter |
1 |
108 |
Local Datastore |
1 |
52 |
vSAN Datastore |
1 |
42 |
TKG Cluster |
1 |
40 |
vSphere with Tanzu |
1 |
208 |
Total |
876 |
To calculate metrics from other objects, use vropssizer
Please note that the vropssizer tool is specifically designed to calculate the size of data nodes in the Aria Operations cluster. These sizing parameters are not applicable to cloud proxy configurations. However, you can still utilize this tool to estimate the number of objects and metrics based on the provided object list.