


A 'real-time' capability is needed to address the needs of power management software running in substations. This guide addresses the performance requirements of the virtual machines, the configuration of these virtual machines, and the virtual protection relay (VPR) software currently being developed to run at the power substation.
This configuration guide was created as part of a partner co-innovation project with VMware partners to assess current vSphere capabilities in running power utility software at the power substation within certain latency tolerances. A 'real-time' capability is needed to address the needs of power management software running in substations. Working together with partners, VMware will look to co-develop a virtualized solution to achieve better consolidation, management, and resiliency for power substations as compared to today’s hardware appliance solutions.
This guide addresses the performance requirements of the virtual machines, the configuration of these virtual machines, and the virtual protection relay (VPR) software currently being developed to run at the power substation.
It details configuration changes made to the Host BIOS/Firmware Configuration, ESXi Configuration, Guest OS configuration, and VSAN and details the deployment method for the VPR software provided by Kalkitech, it details the performance testing and results based on these workloads being provided as a container-based solution (confirmed with other VPR software vendors) and managed via vSphere.
The conclusion of this guide shows that virtualized workloads configured with these settings can successfully meet the requirements of 120 microseconds as shown in the testing section of this document.
Environment Overview
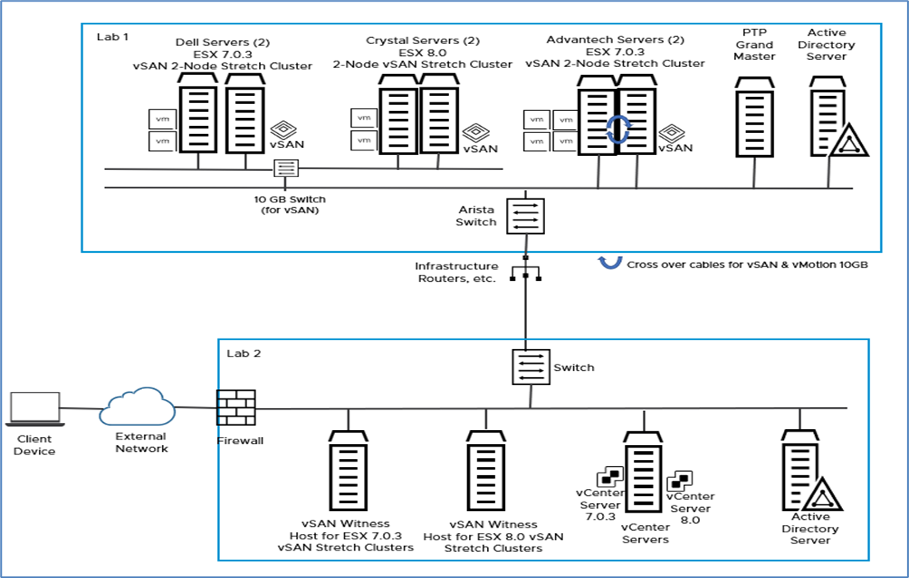
Two labs were utilized for developing this ESXi Real-Time Tuning and Testing Guide. The labs are in Palo Alto, California, and are located at opposite ends of the campus. Utilizing two separate labs required configuring a vSAN Two-Node Stretch Cluster when vSAN was deployed. The host servers that were running the workloads needed to be connected to a Precision Time Protocol (PTP) Grand Master located in Lab 1.
Lab 1 - Host servers running workloads used in this testing included:
2 x Advantech ECU-579 servers deployed in a vSAN Two-Node Stretch Cluster for ESX 7.0.3 testing
2 x Dell PowerEdge XR12 servers deployed in a vSAN Two-Node Stretch Cluster for ESX 7.0.3 testing
2 x Crystal Group ES373S17 servers deployed in a vSAN Two-Node Stretch Cluster for ESX 8.0 testing
Grand Master precision time protocol (PTP) provider - Meinberg 1000
Arista 7050sx3 switch
Lab 2 – Infrastructure Servers for vCenters, vSAN Witness hosts, and Domain Controller
1 x Dell PowerEdge R630 Server with a vSAN Appliance installed acting as the vSAN Witness host for ESXi 7.0.3 testing.
1 x Dell PowerEdge R630 Server acting as the vSAN Witness host for ESXi 8.0 testing.
Additional Dell PowerEdge R630 Server supporting vCenters (7.0.3 and 8.0) and a Domain Controller
Infrastructure
VMware vSphere 7.0 Update 3 environment consisting of:
VMware vCenter 7.0.3c Build 19234570
VMware vSphere Client Version 7.0.3.00300
VMware ESXi 7.0.3c, Build 19193900
vSAN included
Meinberg 1000 acts as the Grand Master and is configured for multicast end-to-end with the default PTP (Precision Time Protocol) profile (announce: 1 message every 2 seconds, sync interval: 1 second, request interval: 1 message every 8 seconds) using domain 0.
Arista 7050sx3 Switch
VMware vSphere 8.0 environment consisting of:
VMware vCenter 8.0.0 Build 20519528
VMware vSphere Client Version 8.0.0.10000
VMware ESXi 8.0.0, Build 20513097
vSAN included
Meinberg 1000 acts as the Grand Master and is configured for multicast end-to-end with the default PTP (Precision Time Protocol) profile (announce: 1 message every 2 seconds, sync interval: 1 second, request interval: 1 message every 8 seconds) using domain 0.
Arista 7050sx3 Switch
Note: All VMware software used is Generally Available (GA) releases.
Hardware Configuration for performance
The following hardware was used:
Server Vendor |
Advantech ECU-579* |
Crystal Group ES373S17** |
Dell PowerEdge XR12 |
|---|---|---|---|
Processor model |
Intel Xeon Gold 6138T CPU @ 2.00 GHz |
Intel Xeon Gold 6230T CPU @ 2.10 GHz |
Intel Xeon Silver 4314 CPU @ 2.40 GHz |
Processor sockets |
1 |
2 |
1 |
Processor cores per socket |
20 |
20 |
16 |
Logical processors |
40 (Hyperthreading Active) |
80 (Hyperthreading Active) |
32 (Hyperthreading Active) |
Memory |
192 GB RAM |
192 GB RAM |
128 GB RAM |
Storage |
Four 1 TB 2.5” SATA SSD drives (internal): 1 for ESXi, 1 for local storage, 1 vSAN cache tier, 1 vSAN capacity/data tier |
One NVMe 480GB SATA SSD drive (internal for ESXi). Four 1 TB 2.5” SATA SD drives (internal): 2 for local storage, 1 vSAN cache tier, 1 vSAN capacity/data tier |
Two 480 GB SATA SSD drives (internal): 1 for ESXi, 1 for local storage. Two 1.92 TB DATA SSD drives (internal for local storage) |
ESXi |
Version 7.0.3c Build 19193900 |
Version 8.0 Build 20513097 |
Version 7.0.3c Build 19193900 |
Power Management*** |
High Performance |
High Performance |
High Performance |
Storage |
vSAN Enabled |
vSAN Enabled |
vSAN Enabled |
* The Crystal Group ES373S17 hosts are not in the VM hardware compatibility list and are currently being evaluated.
** Power Management Policy changed by logging into ESXi: ESXi -> Host -> Manage -> Hardware -> Power Management -> Change Policy -> Select High Performance and click OK. Select High Performance so that ESX does not use any power management features that could potentially introduce a latency response.
The following Host BIOS Settings were used to enable maximum performance:
Hyperthreading – Active
SpeedStep (P States) – Disabled
Energy Efficient Turbo – Disabled
CPU C States – Disabled
Intel Virtualization Technology for Directed I/O (VT-d) - Enabled
Note: Advantech does not have a concept of a ‘System Profile = Performance’ like Dell. Advantech’s recommendation is to use Energy Efficient Turbo–Enabled. This means that the Power Management setting in vSphere will show ‘Balanced’ and not ‘Performance.’ Tested the following – changed the Power Management setting to ‘Performance’ from the vSphere Client, which did not have any effect on test results. This setting should be changed via the Host BIOS settings.
vSphere Configurations
ESXi Cluster Configuration
The following ESXi cluster features were used:
vSphere DRS (Distributed Resource Scheduler) – Disabled
Normally DRS is very desirable for vSAN since it will provide initial placement assistance of VMs and load balance the environment when there is an imbalance and will automatically migrate virtual machines to their correct site in accordance with VM/Host affinity rules. For our testing and given the characteristics of the workloads we wanted the VMs on a specific host and not to migrate during a test.
vSphere HA (High Availability) – Enabled
vSAN Services – Enabled
Host Configuration for performance
ESXi 7.0.3c Build 19193900 was used during testing. This is the latest GA version of ESXi 7.0 which provides updates to reduce compute and I/O latency, and jitter for latency-sensitive workloads. Latency-sensitive workloads, such as in financial and telecom applications, can see a significant performance benefit from I/O latency and jitter optimizations.
ESX 8.0 Build 20513097 was recently released (as of the writing of this document) and was also used during testing.
Virtual Machine Configuration for performance
Based on discussions with Intel and without full details of guest workloads and their requirements it was agreed to use VMware Photon OS with the real-time kernel inside the virtual machines due to the requirements for the real-time Operating System.
Note: It was also discussed and decided that workloads on the ESXi hosts would not be overcommitted on memory or CPU resources when running real-time applications.
Configure the Virtual Machines (VMs) with the following configuration:
4 VM Configuration
4 vCPUs
16 GB RAM of memory
40 GB Disk using vSAN storage or local storage
The following software was installed on the VMs:
Photon 3.0 (x86_64) – Kernel 4.19.256-5.ph3-rt
VMware Tools version 11296
Cyclictest v2.3
Update Photon to the latest real-time kernel version:
Log into the VM and at the command prompt type the following:
tdnf update libsolv
tdnf update linux-rt
reboot VM (two times)
Be sure to update the Photon OS to the latest kernel version as recent optimizations have been made to avoid guest timer interference, which gives significant latency improvements with cyclictest.
The following settings were changed to enable the best performance for the Virtual Machine. They can be changed via the VM’s Edit Settings when the VM is powered off.
Configure vCPUs / Cores per Socket / Number of Sockets
Edit Settings -> Virtual Hardware tab -> CPU -> vCPUs and Cores per Socket -> Select 1 for Cores per Socket and click OK
Disable Logging on the VM
Edit Settings -> VM Options tab -> Advanced -> Settings -> Deselect “Enable logging” and click OK
Enable Backing Guest vRAM
Edit Settings -> VM Options tab -> Advanced -> Configuration Parameters -> click Edit Configuration -> Click on Add Configuration Params and add:
sched.mem.lpage.enable1GPage=”TRUE”and click OK
Advanced Settings to benefit compute latency and timers
Edit Settings -> VM Options tab -> Advanced -> Configuration Parameters -> click Edit Configuration -> Click on Add Configuration Params and add:
sched.cpu.affinity.exclusiveNoStats=”TRUE”add:
monitor.forceEnableMPTI=”TRUE”add:
timeTracker.lowLatency=”TRUE”and click OK
Set VM Latency Sensitivity to High
Set CPU Reservation: Edit Settings -> Virtual Hardware tab -> CPU -> Reservation -> Enter the number of MHz to reserve and click OK
Set Memory Reservation: Edit Settings -> Virtual Hardware tab -> Memory -> Reservation -> Select “Reserve all guest memory (All locked) and click OK
Set Latency Sensitivity: Edit Settings -> VM Options tab -> Advanced -> Latency Sensitivity – Select “High” and click OK
Both the CPU and Memory Reservations must be set before setting the Latency Sensitivity to ‘High.’
By setting the VM Latency Sensitivity to ‘High’ you are eliminating major sources of extra latency imposed by virtualization to achieve low response time and jitter. This setting requires exclusive access to physical resources to avoid resource contention due to sharing. This is done with the CPU and Memory Reservations. The CPU Reservation reserves the appropriate amount of MHz to allow the ESX scheduler to determine the best processors on which to run the workload. So, in essence, the ESX scheduler is ‘pinning’ the CPUs for you. You do not need to tell ESX which processors to use via the CPU Scheduling Affinity. In addition, the Memory Reservation reserves all guest memory for the VM and workload.
Tuned is a profile-based system tuning tool that offers predefined profiles to handle common use cases, such as high throughput, power saving, or low latency.
Update Tuned
Log into the VM as
rootTo start Tuned, type this command:
systemctl start tunedTo enable Tuned to start every time the machine boots, type:
systemctl enable tunedTo update, type:
rpm -qa tunedTo update, type:
tdnf update tuned
Isolate vCPU to run the workload/Cyclictest using Tuned
Edit the following file with vi:
vi /etc/tuned/realtime-variables.confFollow the examples provided and add the following line:
isolated_cores=1Save the change to the file.
Isolating vCPUs is different than pinning CPUs.
When you pin CPUs, you are telling the scheduler to use these specific physical CPUs on the host for a particular VM.
When you isolate vCPUs, you are telling the VM to use these vCPU(s) for the workload which leaves the other vCPU(s) for the GuestOS.
Set the OS Profile
Use ‘Tuned’ to set the OS profile to ‘realtime’
To view the available installed profiles, run this command:
tuned-adm listTo view the currently activated profile, run this command:
tuned-adm activeTo select or activate a profile, run this command:
tuned-adm profile realtimeTo verify that the real-time profile is active, type this command:
tuned-adm activeReboot the GuestOS: reboot
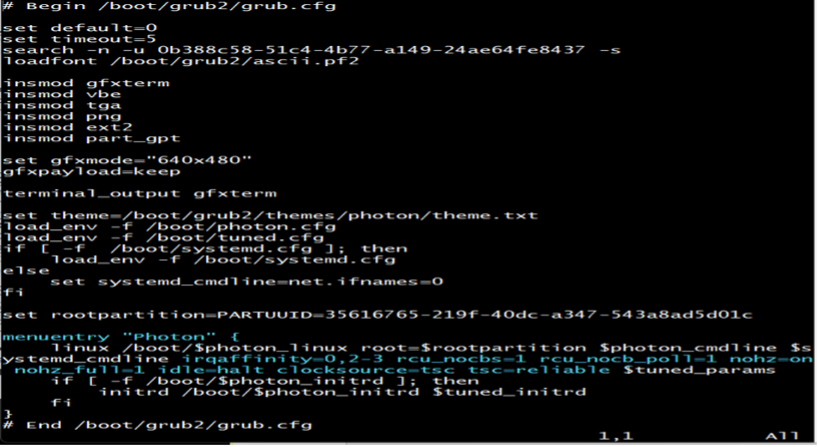
Additional Parameters for Photon OS using grub.cfg file
Edit the following file with vi:
vi /boot/grub2/grub.cfgAdd the following parameters on the
menuentryline:
Parameters |
Example* |
Comments |
|---|---|---|
irqaffinity=<list of non-isolated vCPUs> |
irqaffinity=0,2-3 |
Interrupt affinity – steer interrupts away from isolated vCPUs |
rcu_nocbs=<list of isolated vCPUs> |
rcu_nocbs=1 |
RCU callbacks – steer movable OS overhead away from isolated CPUs |
rcu_nocb_poll=1 |
rcu_nocb_poll=1 |
|
nohz=on |
nohz=on |
Eliminating periodic timer – avoid periodic timer interrupts |
nohz_full=<list of isolated vCPUs> |
nohz_full=1 |
|
idle=halt |
idle=halt |
CPU idle – Prevent CPUs from going into deep sleep states |
clocksource=tsc |
clocksource=tsc |
Timer skew detection |
Save changes and reboot VM |
tsc=reliable |
Timer skew detection |
The grub.cfg file has a single menuentry line for the Photon OS as shown below (highlighted in blue) and is kept independent of the kernel rpm. Hence, any changes you make here will remain valid and applicable, even if you change/update the kernel flavor or version. The parameters must be appended to the same line, without introducing any new line characters.
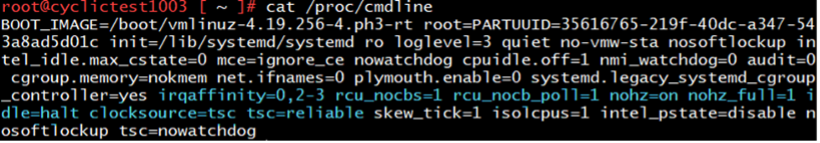
Verify that the variables were added correctly. At the command prompt type: cat /proc/cmdline
You should see something like this.
Precision Time Protocol
A Meinberg 1000 is acting as the Grand Master and is configured for multicast end-to-end with the default PTP profile (announce: 1 message every 2 seconds, sync interval: 1 second, request interval: 1 message every 8 seconds) using domain0.
Precision Time Protocol Configuration
The following instructions can be followed to configure time synchronization between VMs and a centralized clock source using a PTP host.
The PTP and the NTP services cannot run simultaneously. Disable the NTP service and then enable the PTP service. Additionally, when you enable the PTP service, the manual time configuration becomes inactive.
Change the NTP and PTP Service Status on the Host Manually
In the vSphere Client home page, navigate to Home > Hosts and Clusters.
Select a host.
On the Configure tab, select System > Services.
Change the status of the NTP or PTP service.
-
Option
Description
Change the NTP service status
Select NTP Daemon.
Click Stop
Change the PTP service status
Select PTP Daemon.
Click Start
-
Use PTP Servers for Time and Date Synchronization of a Host
In the vSphere Client home page, navigate to Home > Hosts and Clusters.
Select a host.
On the Configure tab, select System > Time Configuration.
In the Precision Time Protocol pane, click Edit.
In the Edit Precision Time Protocoldialog box, edit the precision time protocol settings.
Select Enable.
From the Network interface drop-down menu, select a network interface.
Click OK.
Sync Guest OS with Host time
Edit Settings -> VM Options tab -> VMware Tools -> Synchronize Time with Host -> Select Synchronize time periodically and click OK
Enhancements have been made to ESX with regards to PTP configuration which enable a more accurate time synchronization throughout the stack, these will be investigated as part of the next version of this document.
Test Software Installation
For benchmarking, we use the Cyclictest software. Cyclictest is one of the most frequently used tools for evaluating the relative performance of real-time systems. Cyclictest accurately and repeatedly measures the difference between a thread’s intended wake-up time and the time at which it wakes up to provide statistics about the system’s latencies.
To install the Cyclictest software, do the following:
Install the following packages using the following commands:
tdnf install -y gcc make patch
tdnf install -y git glibc-devel binutils
tdnf install -y linux-api-headers libnuma-devel.x86_64
Make a directory called:
mkdir rt-testsChange directory:
cd rt-testsType the following command*:
curl https://mirrors.edge.kernel.org/pub/linux/utils/rt-tests/rt-tests-2.3.tar.gz > rt-tests-2.3.tar.gz-
Note:
Check this URL for the latest Cyclictest version.
-
Type the following command:
tar xvzf rt-tests-2.3.tar.gzChange directory:
cd rt-tests-2.3Type the following command:
make allType the following command:
make installType the following command:
make Cyclictest
Check the webpage before running this command to verify if there is a more recent version of the Cyclictest that can be downloaded. For an older / specific version of the Cyclictest check the "older" directory at: https://mirrors.edge.kernel.org/pub/linux/utils/rt-tests/older/
The Cyclictest software is now installed. Type the following command to run the Cyclictest:
taskset -c 0-1 ./Cyclictest -m -p 99 -i 100 -t 1 -a 1 -h 120 -D 1m - -mainaffinity=0 -q
When you run this command, either SSH into VM and run in the background or from Console, run the command in the background, close the console, and do not open the console again till the test has finished. The best method is to SSH into the VM and run the command in the background.
Variable |
Variable Name |
Variable Description |
|---|---|---|
taskset |
Taskset mask command [arguments] |
Taskset is used to set or retrieve the CPU affinity of a running process. |
-c # |
cpu list |
Interpret mask as numerical list of processors instead of a bitmask. Numbers are separated by commas and may include ranges. For example: 0, 1, 5, 8-11 |
-m |
mlockall |
Lock current and future memory allocations to prevent being paged out |
-p PRIO |
Prio=PRIO |
Priority of highest prio thread |
-i INTV |
Interval=INTV |
Base interval of thread in microseconds (µs) default=1000 µs |
-t NUM |
Threads=NUM |
Number of threads |
-a NUM |
affinity |
Run thread #N on processor #N, if possible, with NUM pin all threads to the processor NUM |
-h US |
Histogram-US |
Dump a latency histogram to stdout after the run. US is the max latency time to be tracked in microseconds (µs) |
-D TIME |
Duration=TIME |
Run the test for the specified time which defaults to seconds. Append ‘m,’ ‘h,’ or ‘d’ to specify minutes, hours, or days |
--mainaffinity |
Mainaffinity=CPUSET |
Run the main thread on CPU#N. This only affects the main thread and not the measurement threads |
-q |
quiet |
Print only a summary on exit (no live updates) |
The information in the above table is from the cyclictest -version command
Query:taskset -c 0-1 ./Cyclictest -m -p 99 -i 100 -t 1 -a 1 -h 120 -D 1m - -mainaffinity=0 -q
Since we are only running one measurement thread (vCPU 1), move the non-RT main thread to a different vCPU (vCPU 0)
taskset -c 0-1run Cyclictest on these vCPUs (measurement thread runs on vCPU 1)--mainaffinity=0(main thread runs on vCPU 0)
Test Results
The following tests were run:
Test A: ESX 7.0.3 environment with Advantech ECU-579 servers running ESX 7.0.3
Two VMs: 4 vCPU, 16 GB RAM, 40 GB disk, Photon 3.0 RT OS, OS profile ‘realtime’, vCPU 1 isolated to run Cyclictest 2.3 for 60 hours. Note: 2 VMs running on vSAN storage.
Photon 3.0 (x86_64) - Kernel Linux 4.19.225-rt101-3.ph3-rt
VM description |
Number of Latency Samples |
Minimum Latency Microseconds (µs) |
Average Latency value Microseconds (µs) |
Max Latency value Microseconds (µs) |
Histogram Overflows* (over 120 µs) |
|---|---|---|---|---|---|
Single VM ESX 7.0.3c vSAN Storage |
2,160,000,000 |
3 |
4 |
29 |
0 |
Single VM ESX 7.0.3c vSAN Storage |
2,160,000,000 |
2 |
3 |
34 |
0 |
*Histogram Overflows – Number of samples over cyclictest -h value
Test B: ESX 7.0.3 environment with Dell PowerEdge XR12 servers running ESX 7.0.3
Two VMs: 4 vCPU, 16 GB RAM, 40 GB disk, Photon 3.0 RT OS, OS profile ‘realtime’, vCPU 1 isolated to run Cyclictest 2.3 for 60 hours. Note: 2 VMs running on vSAN storage.
Photon 3.0 (x86_64) - Kernel Linux 4.19.224-rt100-2.ph3-rt
VM description |
Number of Latency Samples |
Minimum Latency Microseconds (µs) |
Average Latency value Microseconds (µs) |
Max Latency value Microseconds (µs) |
Histogram Overflows* (over 120 µs) |
|---|---|---|---|---|---|
Single VM ESX 7.0.3c vSAN Storage |
2,160,000,000 |
1 |
3 |
21 |
0 |
Single VM ESX 7.0.3c vSAN Storage |
2,160,000,000 |
1 |
3 |
23 |
0 |
*Histogram Overflows – Number of samples over cyclictest -h value
Test C: ESX 8.0 environment with Crystal Group ES373S17 servers running ESX 8.0
One VM: 4 vCPU, 16 GB RAM, 40 GB disk, Photon 3.0 RT OS, OS profile ‘realtime’, vCPU 1 isolated to run Cyclictest 2.3 for 7 days.
Photon 3.0 4.19.256-2.ph3-rt
VM description |
Number of Latency Samples |
Minimum Latency Microseconds (µs) |
Average Latency value Microseconds (µs) |
Max Latency value Microseconds (µs) |
Histogram Overflows* (over 120 µs) |
|---|---|---|---|---|---|
Single VM ESX 8.0 vSAN Storage |
6,048,000,000 |
1 |
1 |
17 |
0 |
*Histogram Overflows – Number of samples over cyclictest -h value
