


Webhooks deliver data to other applications, triggered by certain events using HTTP POST. Whenever an event occurs, the source sends an HTTP request to the target application configured for the webhook.
- Select incidents based on match criteria.
- Send the selected incidents and related information to the configured webhook receiver hosted by third-party system.
By receiving the notifications, the third-party systems could either report on them or trigger automated workflows or notify end users automatically in real time.
Procedure
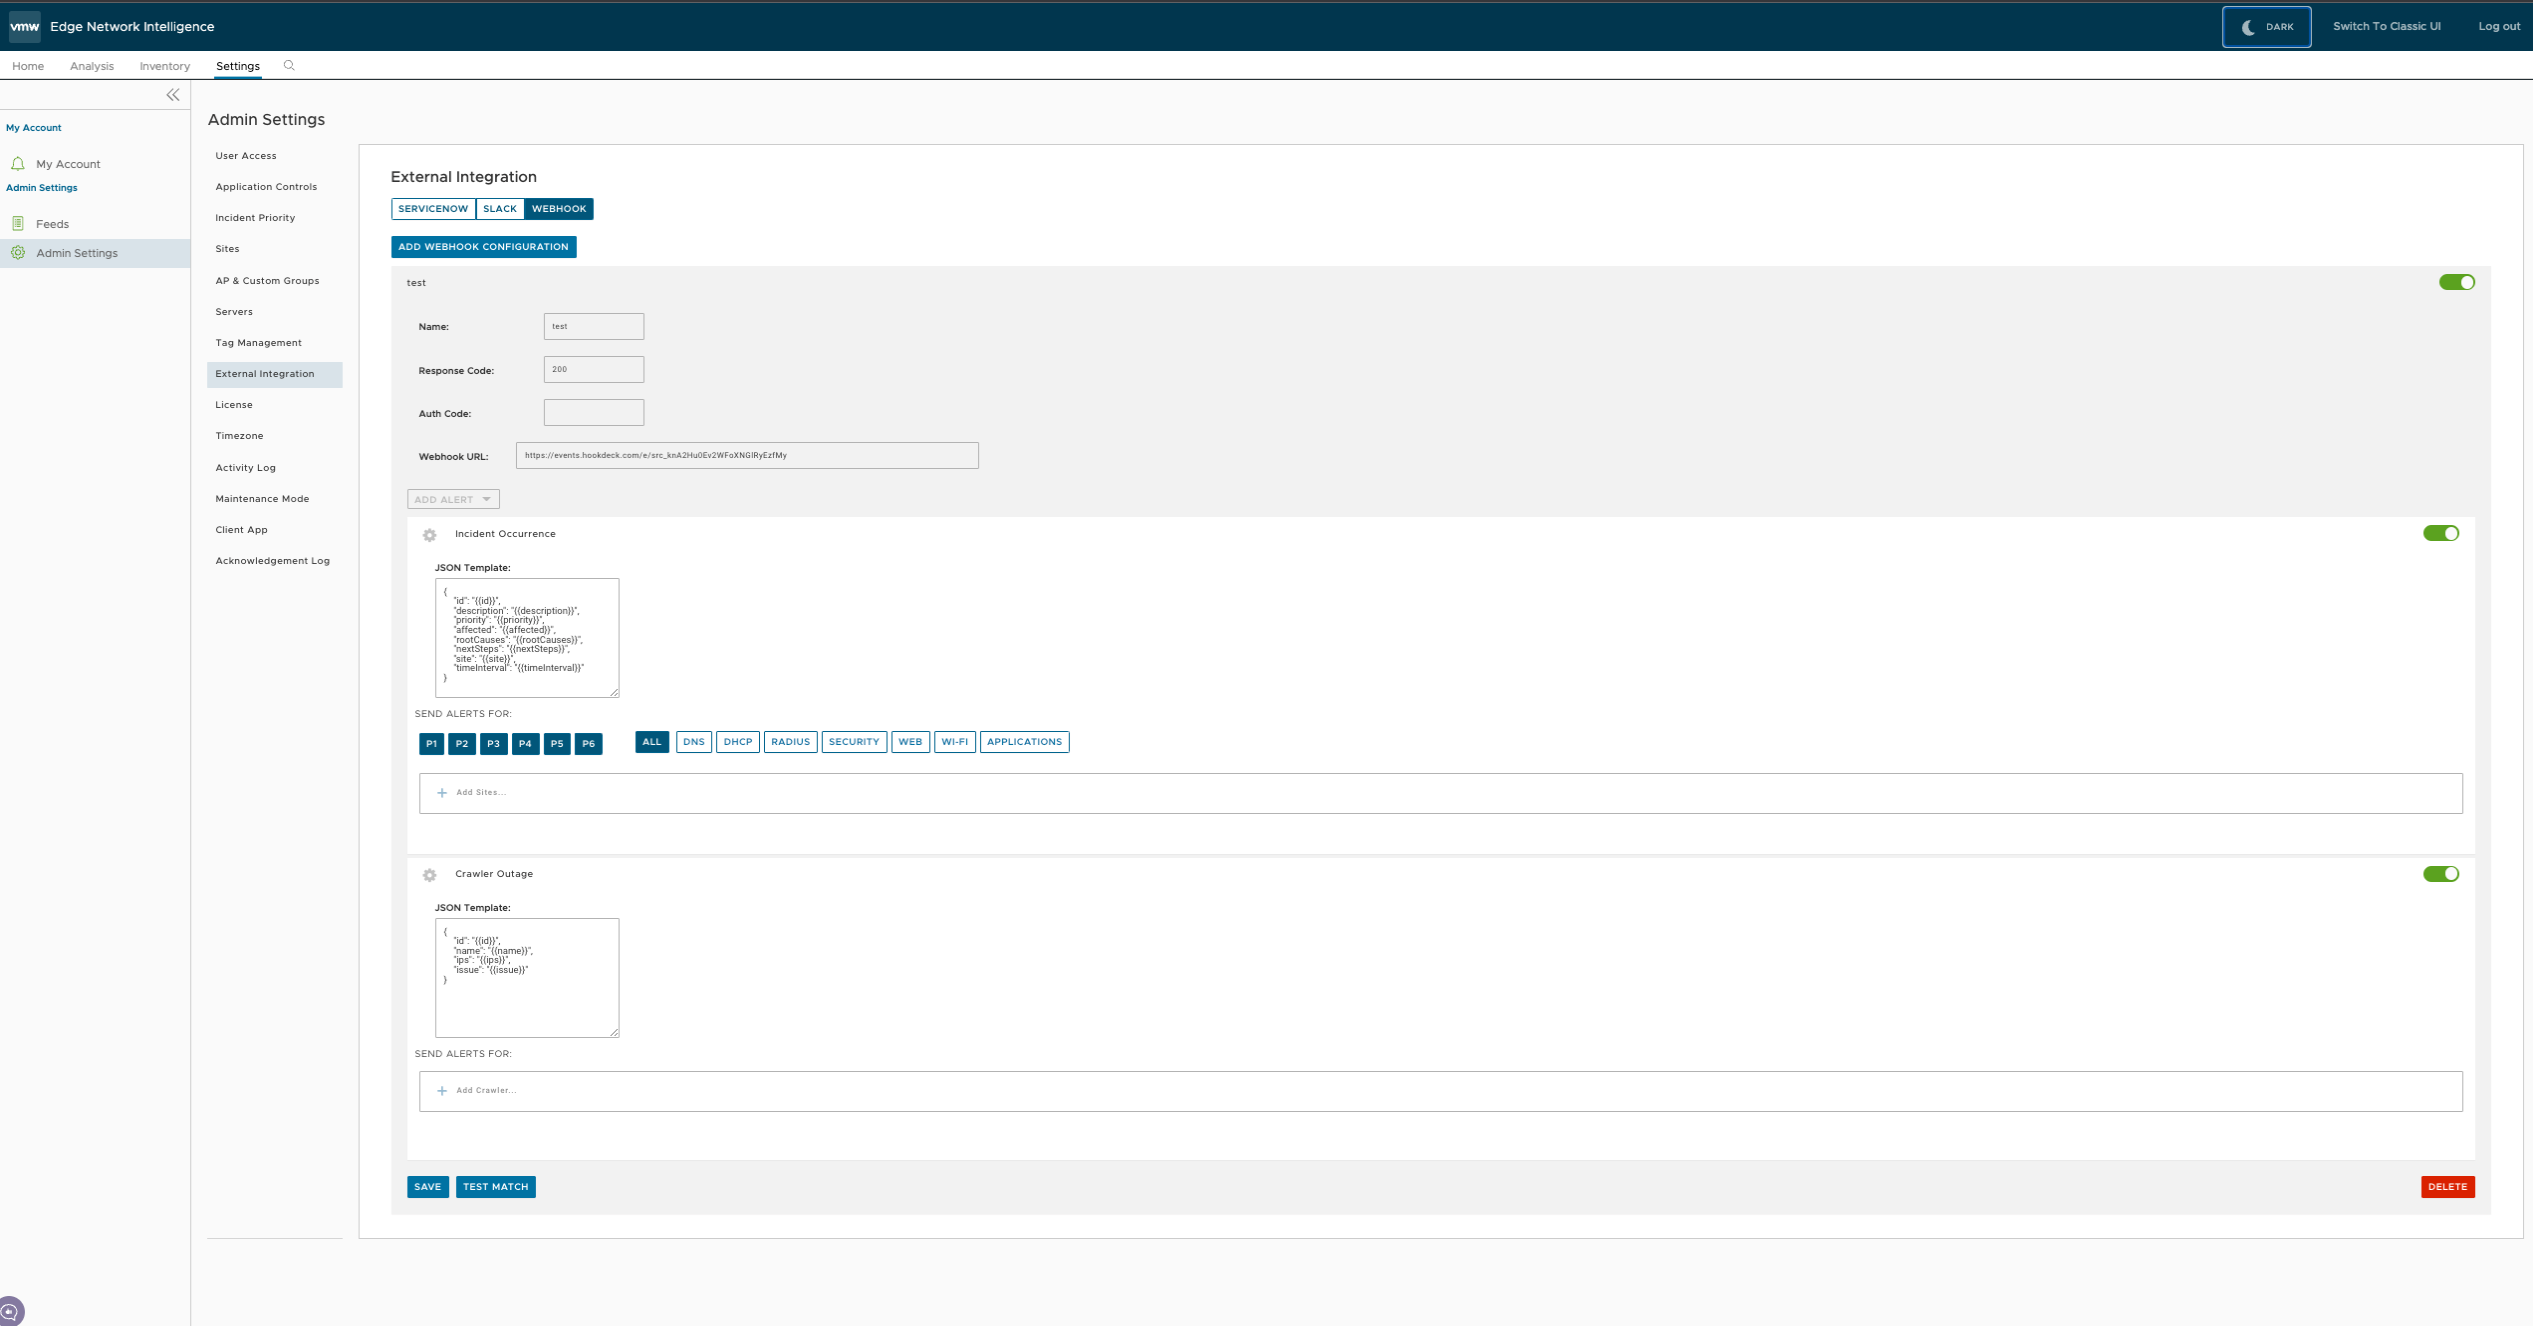
- In the Webhook page, click Add Webhook Configuration.
 Enter the following parameters:
Option Description Name Enter a name for the webhook. Webhook URL Enter a valid HTTPS URL. This serves as the target application for the webhooks. Response Code Enter an expected HTTP response status code for each webhook recipient. Auth Code Specify an authentication code for each configured webhook recipient, which is used to compute an HMAC for each Webhook request sent to the corresponding recipient. For most of the webhook receivers, the HMAC is embedded in a X-Webhook-SignatureHTTP header, along with a version parameter, which identifies the signature algorithm and a timestamp.Click Add Alert to configure the incidents that should send information to the webhook receiver.Alert Type Description JSON Template Send Alerts For Incident Occurrence Switch the slider to ON position to activate the occurrence of incidents. VMware Edge Network Intelligence delivers alert notifications to each webhook recipient, through a JSON payload contained within the body of an outgoing HTTP POST request.
The JSON template consists of the following parameters:- ID
- Description
- Priority
- Number of affected devices
- Root causes for the alert
- Suggested next steps
- Time interval
- Incident link
The following is a sample JSON payload template:{ "id": "p-1131935905", "description": "DHCP protocol/latency issues affected clients", "priority": "2", "affected": "237 out of 2358 devices affected (10.1%)", "rootcauses": "Server is not reachable or Server is not configured", "nextsteps": "Please check if DHCP server is reachable from clients VLAN", "timeInterval": "07:15 - 08:15 on 7/19 PDT" "incidentLink": "https://company.bogus/campus/ui/analysis#/incidents/SERVERS.dnsServerQoE_5minRunAvg?fr=1642_164300&incident-id=p1234" }Choose the parameters like priority and events for which the alerts should be sent. Crawler Outages Switch the slider to ON position to identify the crawler that is experiencing outage issues. The JSON template consists of the following parameters:- ID
- Name
- IP addresses
- Issue
The following is a sample JSON payload template:{ id: "623e00b144fe5ed7959f44bd", name: "Crawler-9", ips: ["192.0.2.0"], issue: "Lost WAN/SPAN connectivity" }Click the + Add Crawler link and add crawlers for which the alerts should be sent.
Results
Whenever an Incident is triggered, an alert message along with relevant information is sent to the target URL.
In the Webhook tab, you can click an existing webhook to view the configured details, Last Notification Status, and Notification History of the incidents.
