The VMware Edge Network Intelligence (ENI) Self-Healing feature monitors and tracks the SD-WAN network for systemic and application performance issues across SD-WAN Edges. ENI then gathers data regarding Edge incidents and triggers remediable recommended actions through an email alert for the incidents.
Prerequisites
To use the ENI Self-Healing feature, ensure you have the following prerequisites:
- The SD-WAN Orchestrator must be on 5.0.1 and the SD-WAN Edges must be running a minimum of 4.3.1 code.
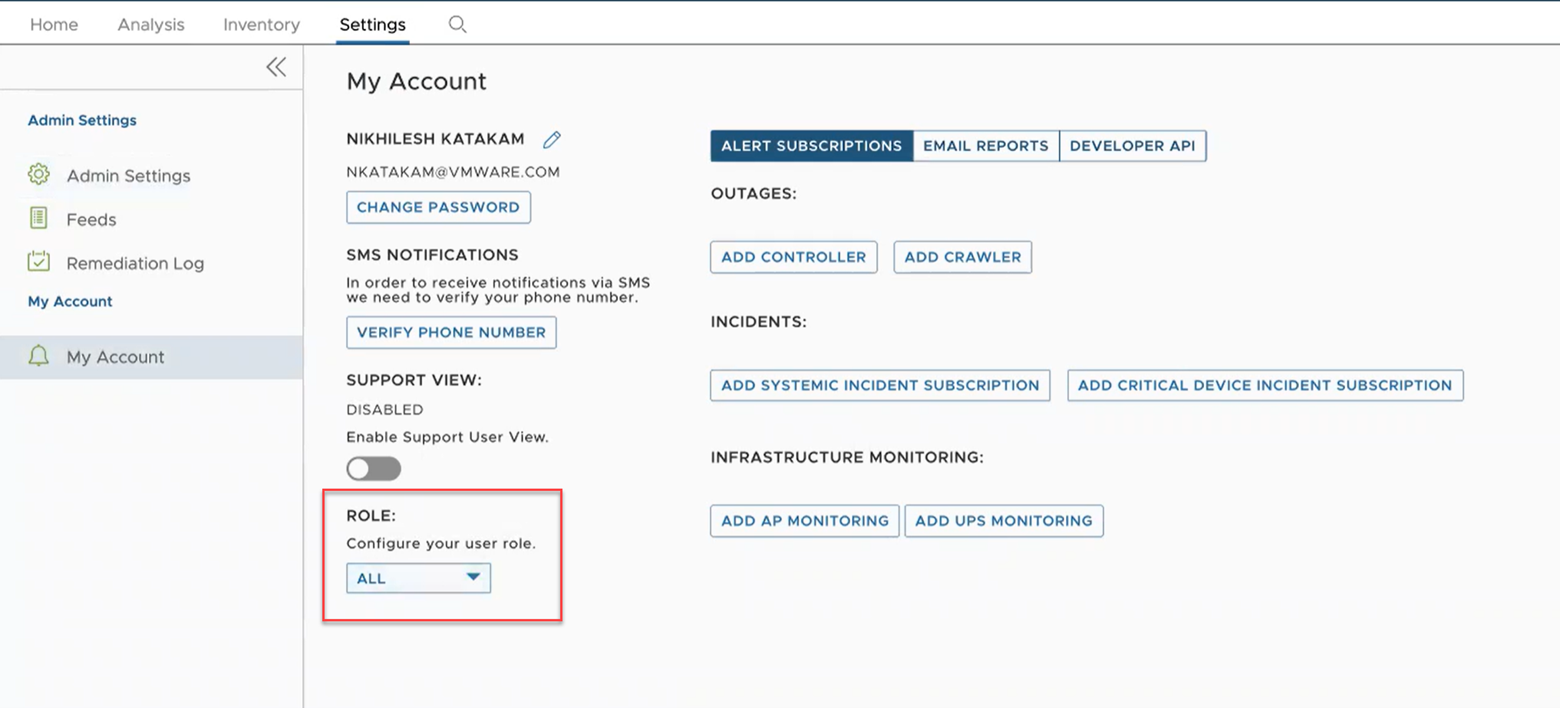
- Full access permission to the VMware ENI product to take a remediation action. Go to Settings > User Access and set User Role Permission to ALL.
Remediate SD-WAN Edges
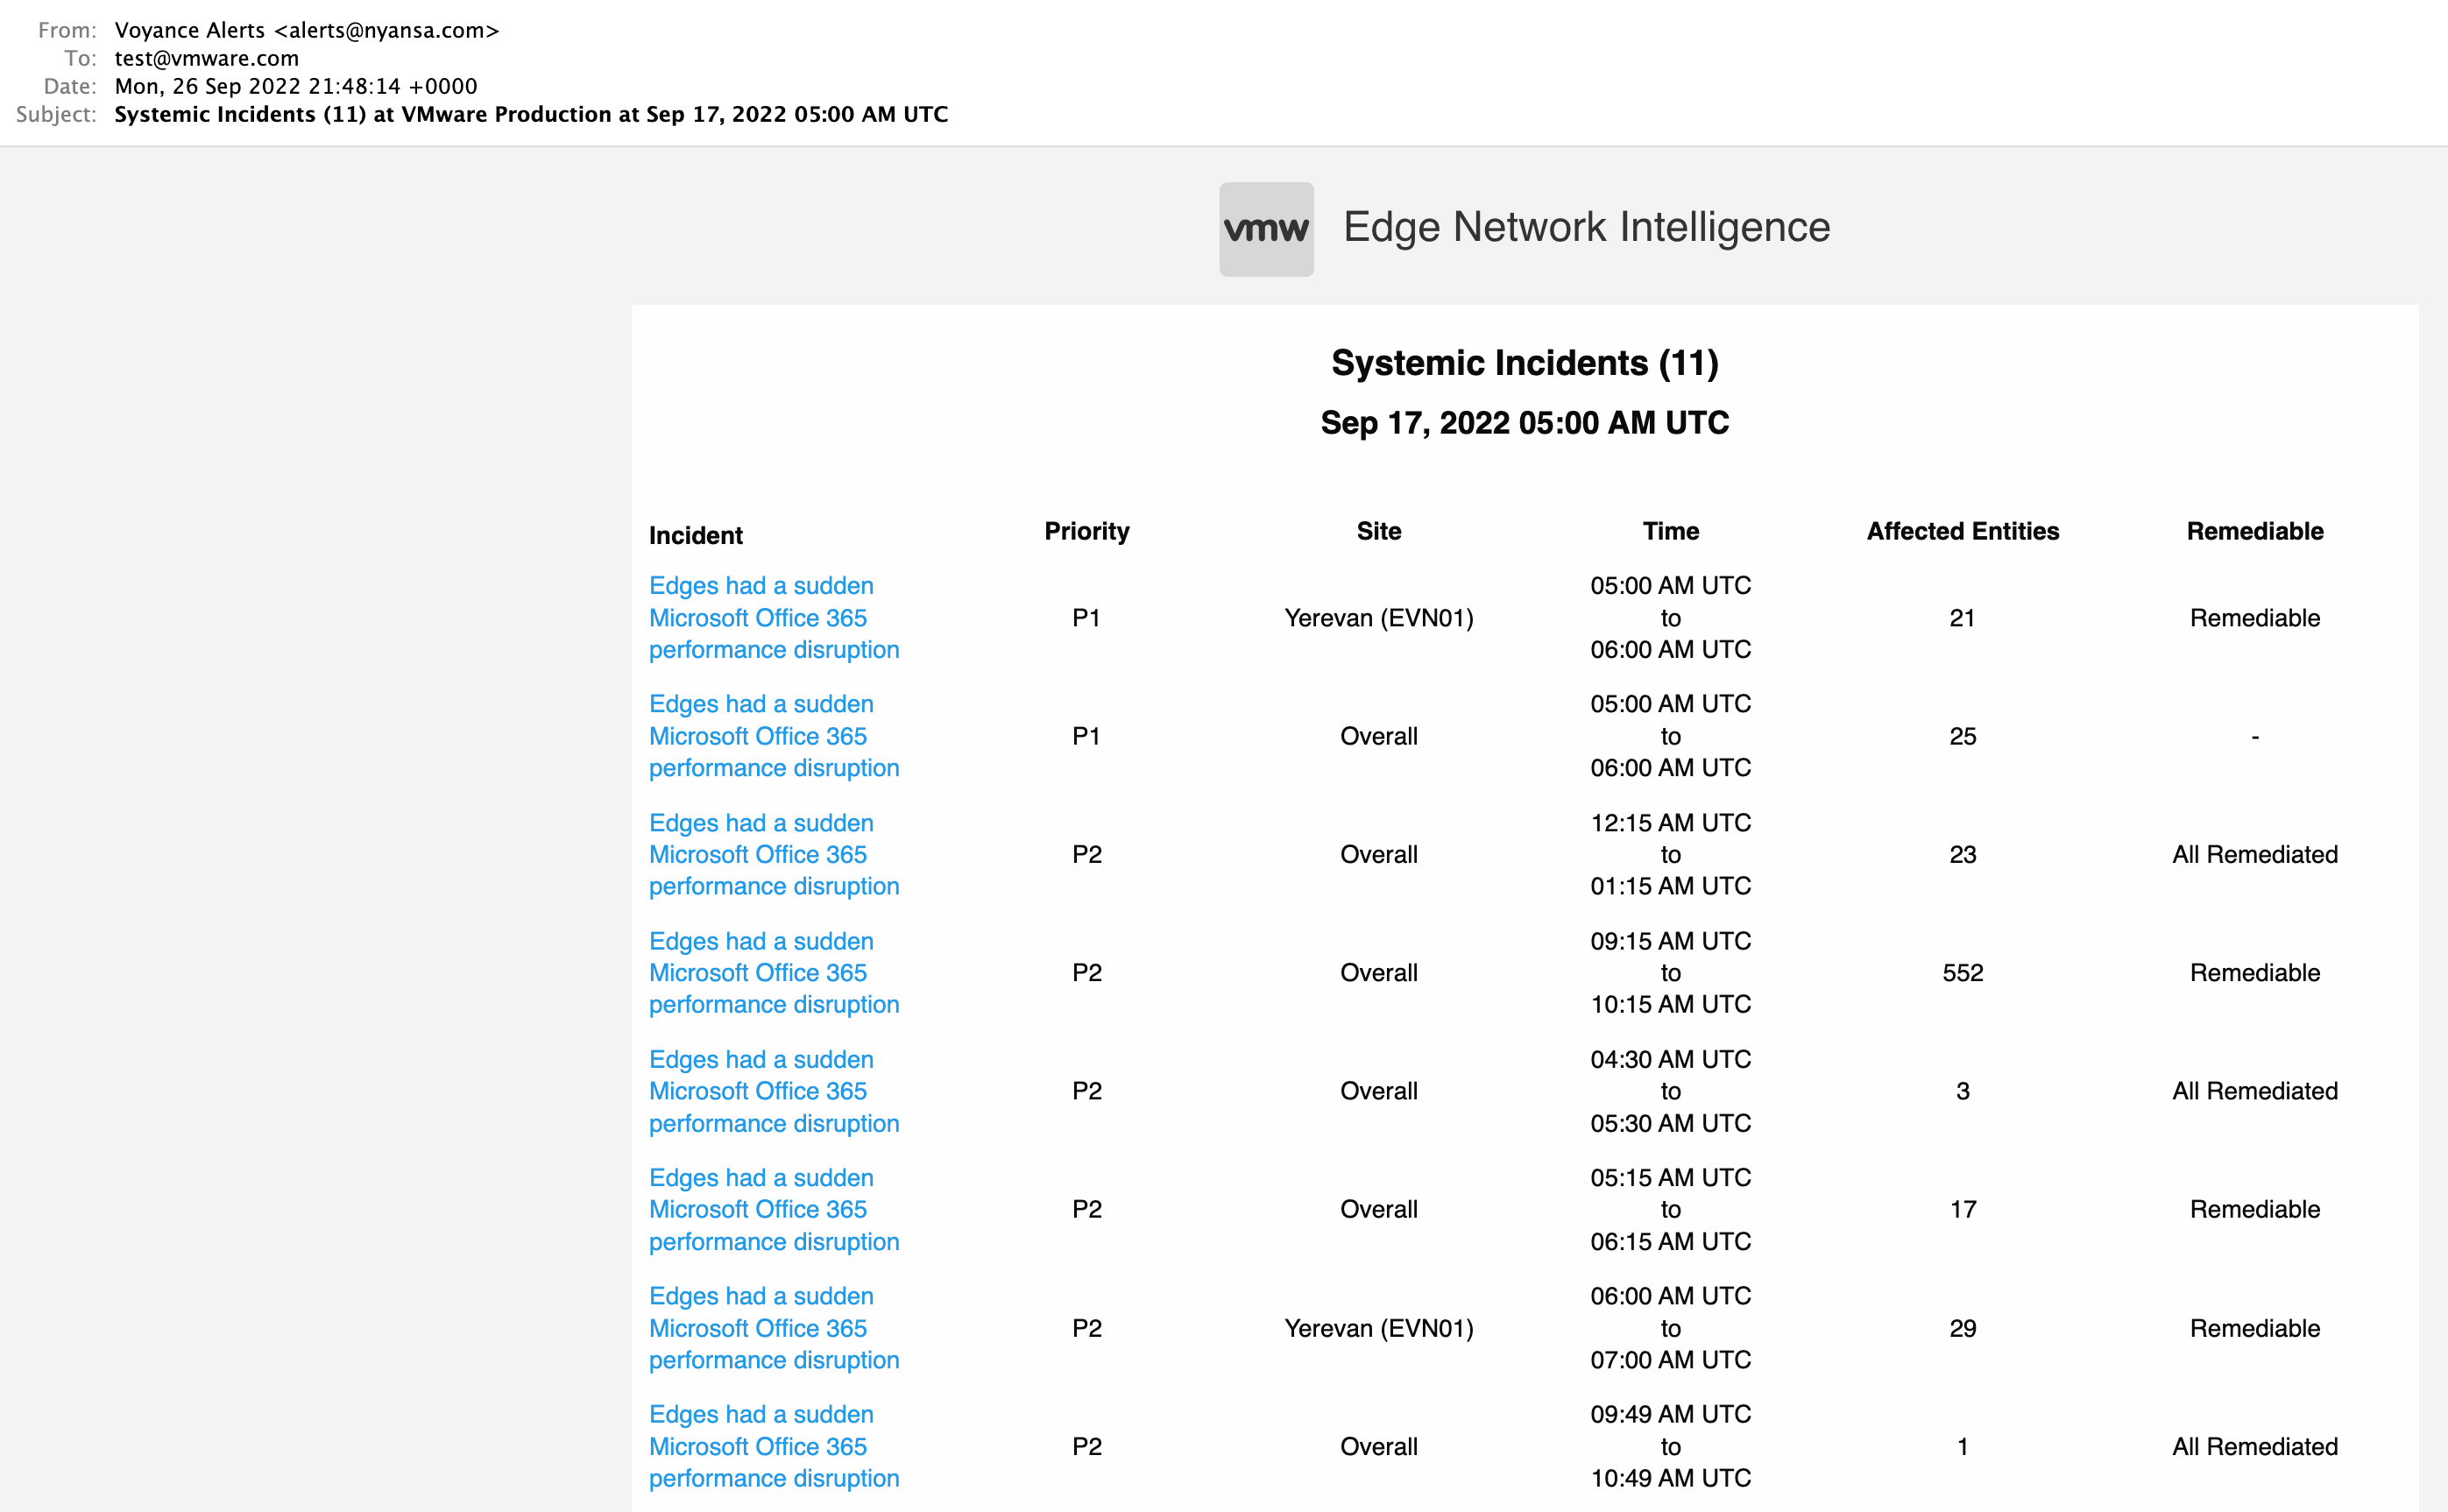
Whenever the analytics engine identifies an Edge experiencing a sudden drop in application performance compared to its recent history, it creates an Edge incident and triggers a remediable recommended action through an email alert for the incident.
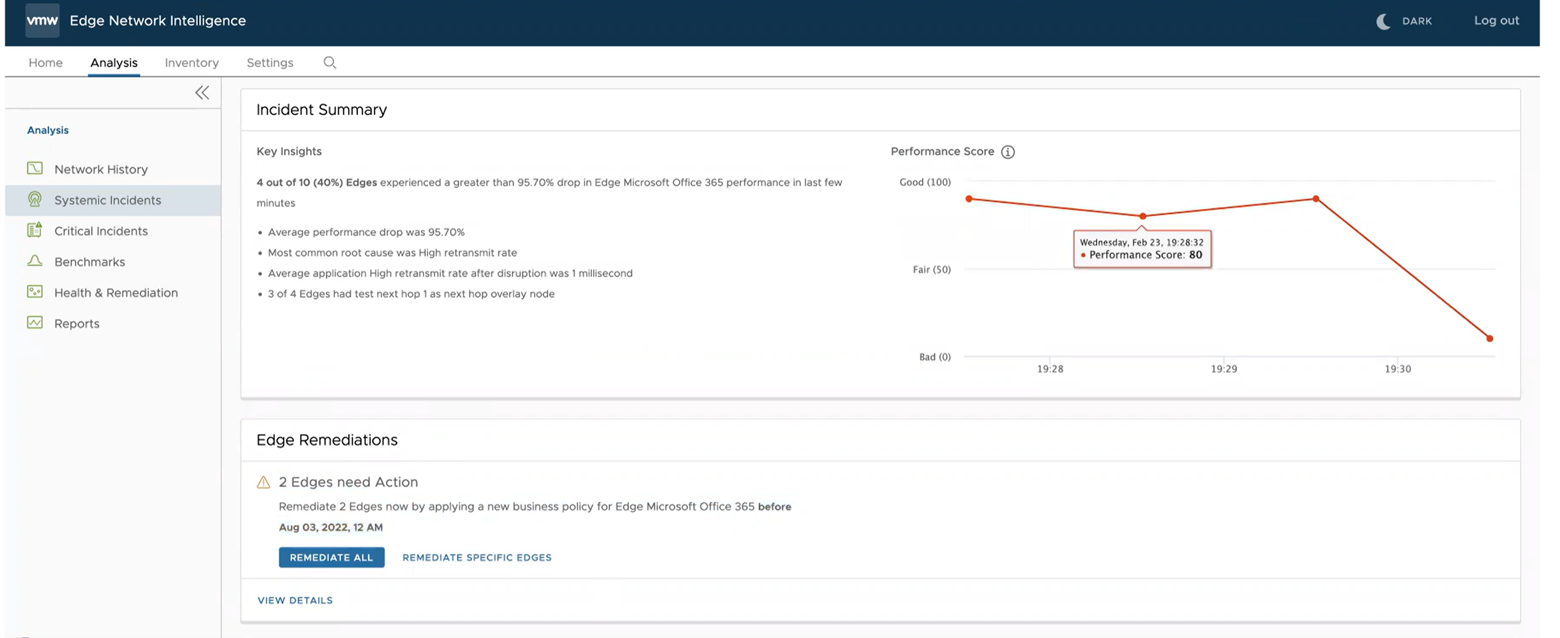
- Click Remediate All to remediate all Edges at once. The Remediation Edges for this Incident dialog box appears.
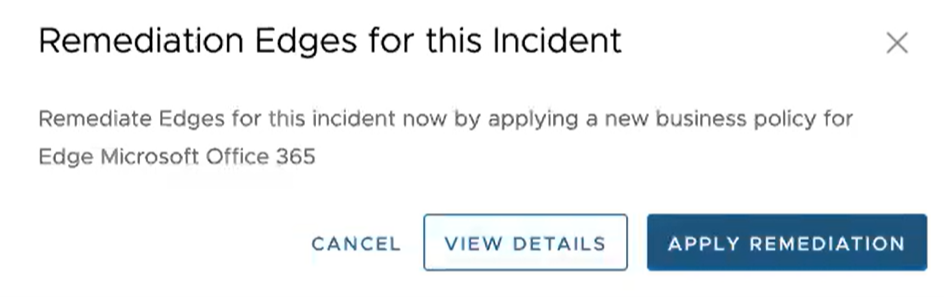
- Click Apply Remediation to remediate all Edges.
- Click View Details to view Remediation Summary of all Edges.
- If you want to remediate specific Edges, click Remediate Specific Edges. The Remediation Summary dialog box appears.
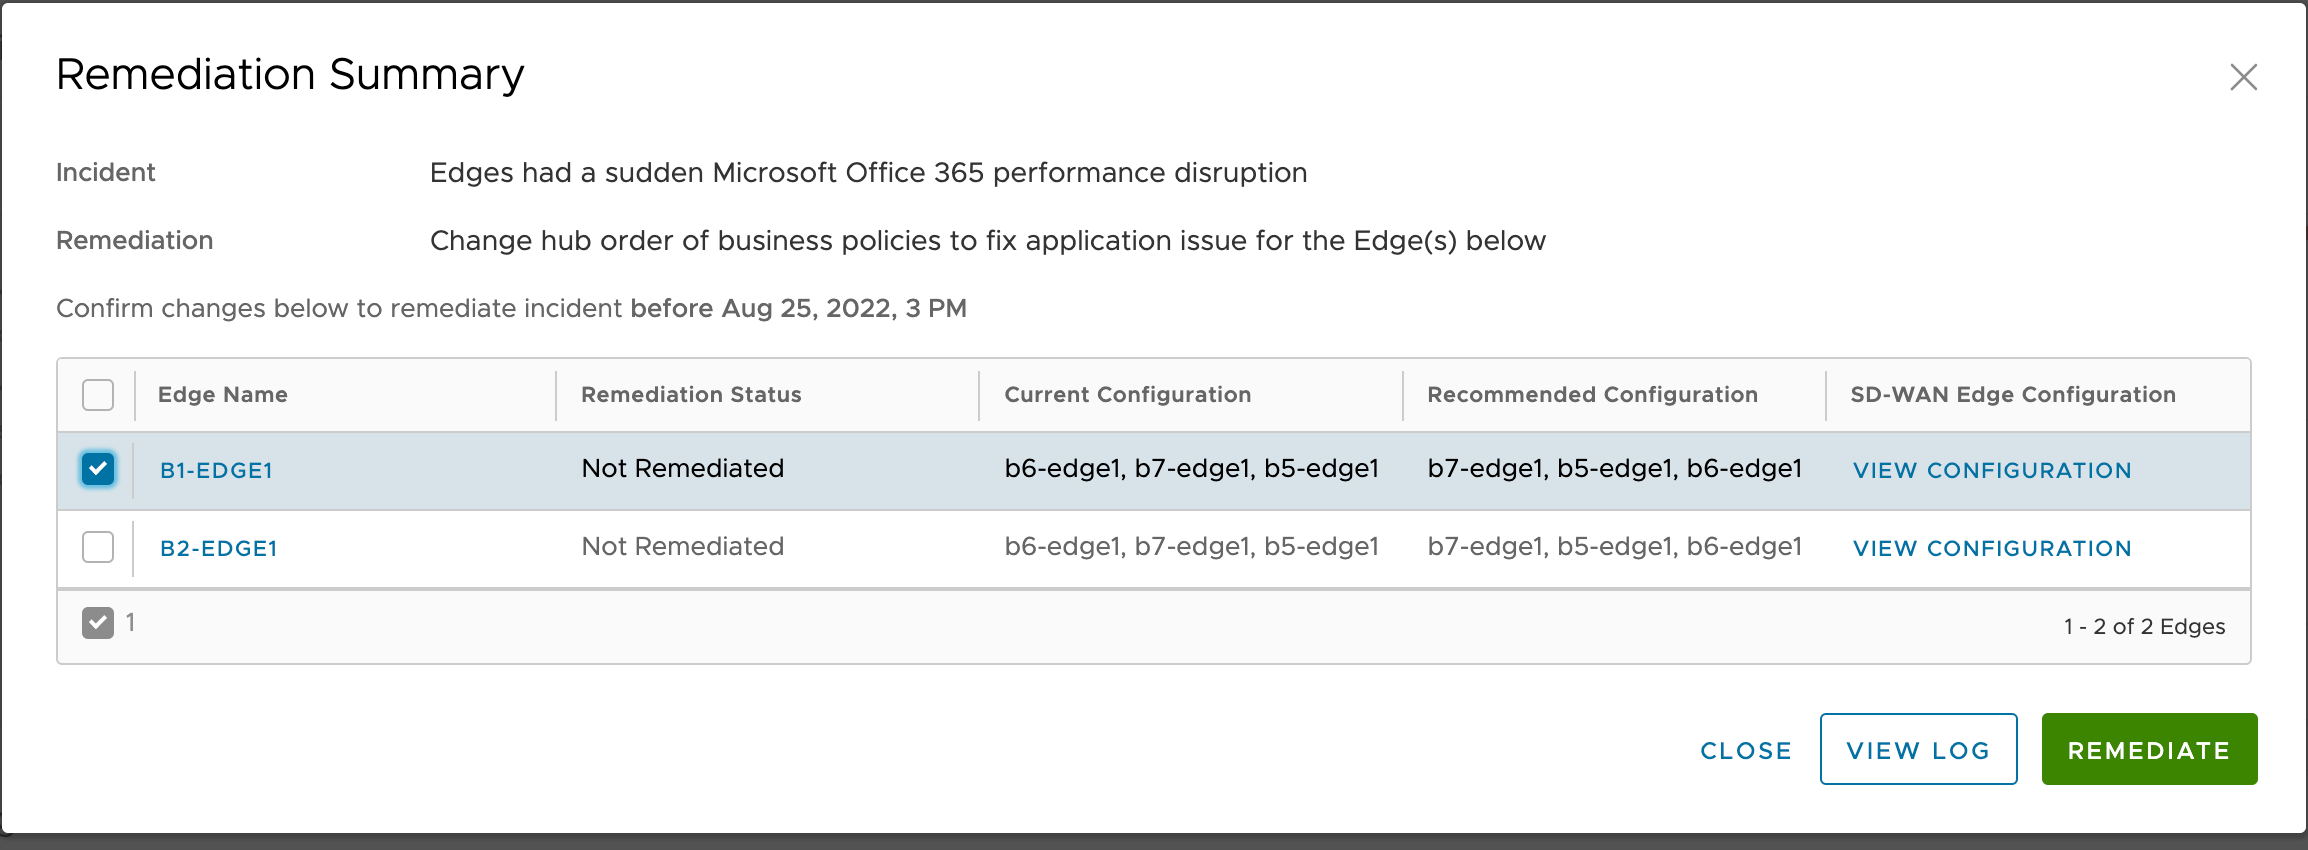
- Select the Edges that you want to remediate and click the Remediate button. The remediation process begins for the selected Edges and the Remediation Status column gets updated automatically based on the remediation state of the Edges.
The following are the supported Edge remediation states:
- Not Remediated – Remediation action is yet to be applied for the Edges
- Pending – Remediation action applied and is in progress for the Edges
- Applied - Remediation successfully applied for the Edges
- Failed – Remediation action taken but failed for the Edges
- Expired - Remediation action is not taken within 3 hours of the incident generation time, so the remediation action is expired
- After applying remediation, you can click View Log to view remediation logs for the Edges.
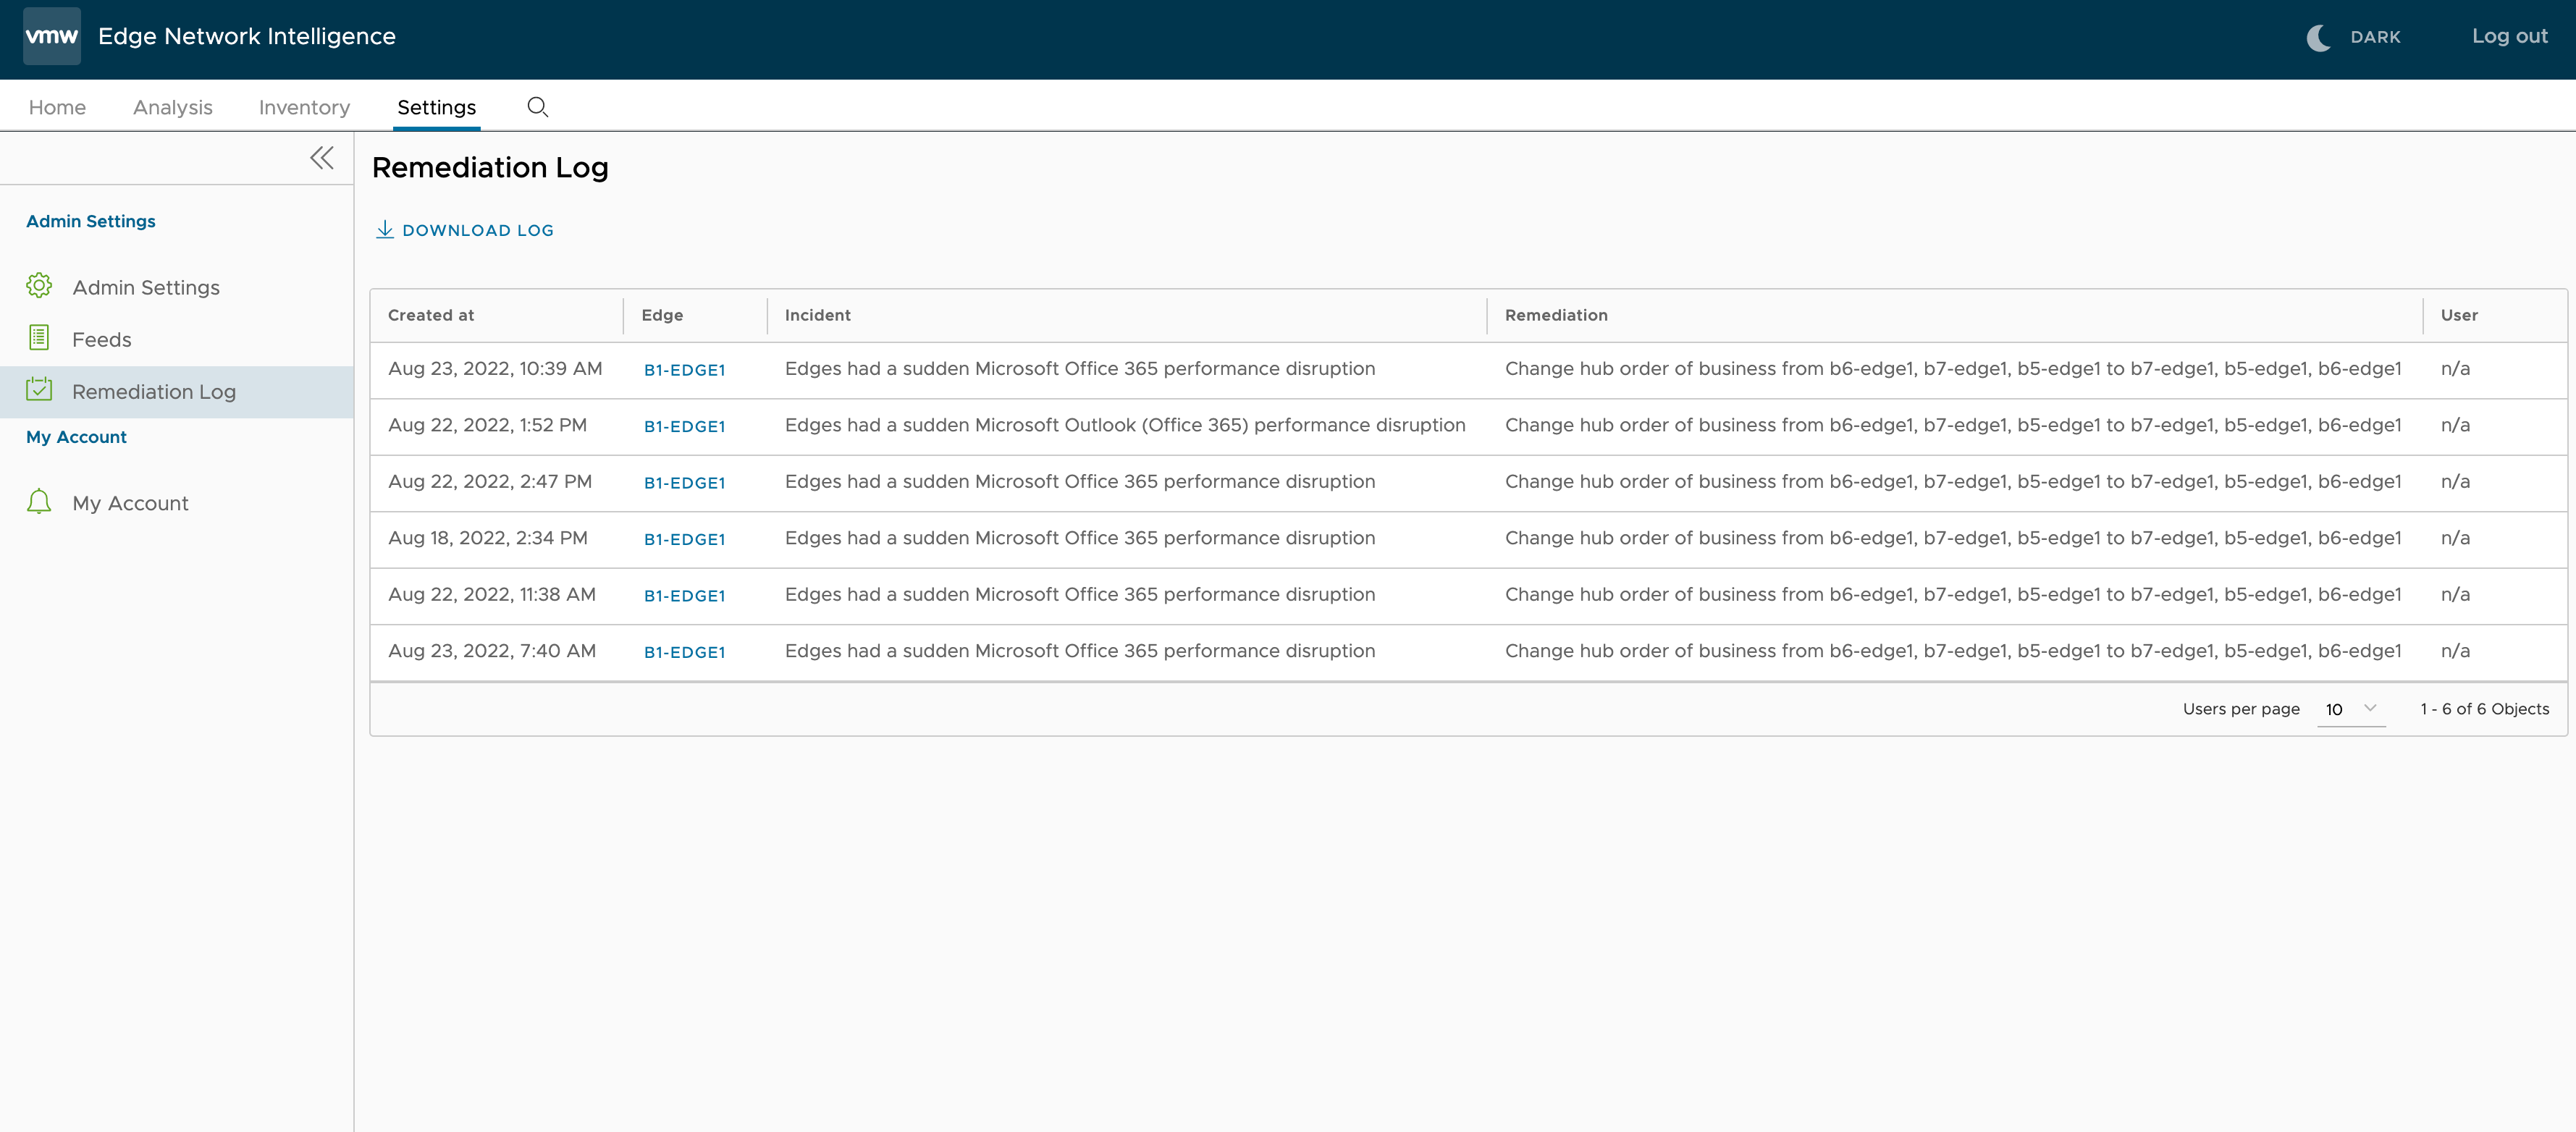
Review Incident Details and Remediation Logs After Applying Remediation
In ENI, after applying remediations, you can review incident details and remediation logs by navigating to the Settings > Remediation log menu.
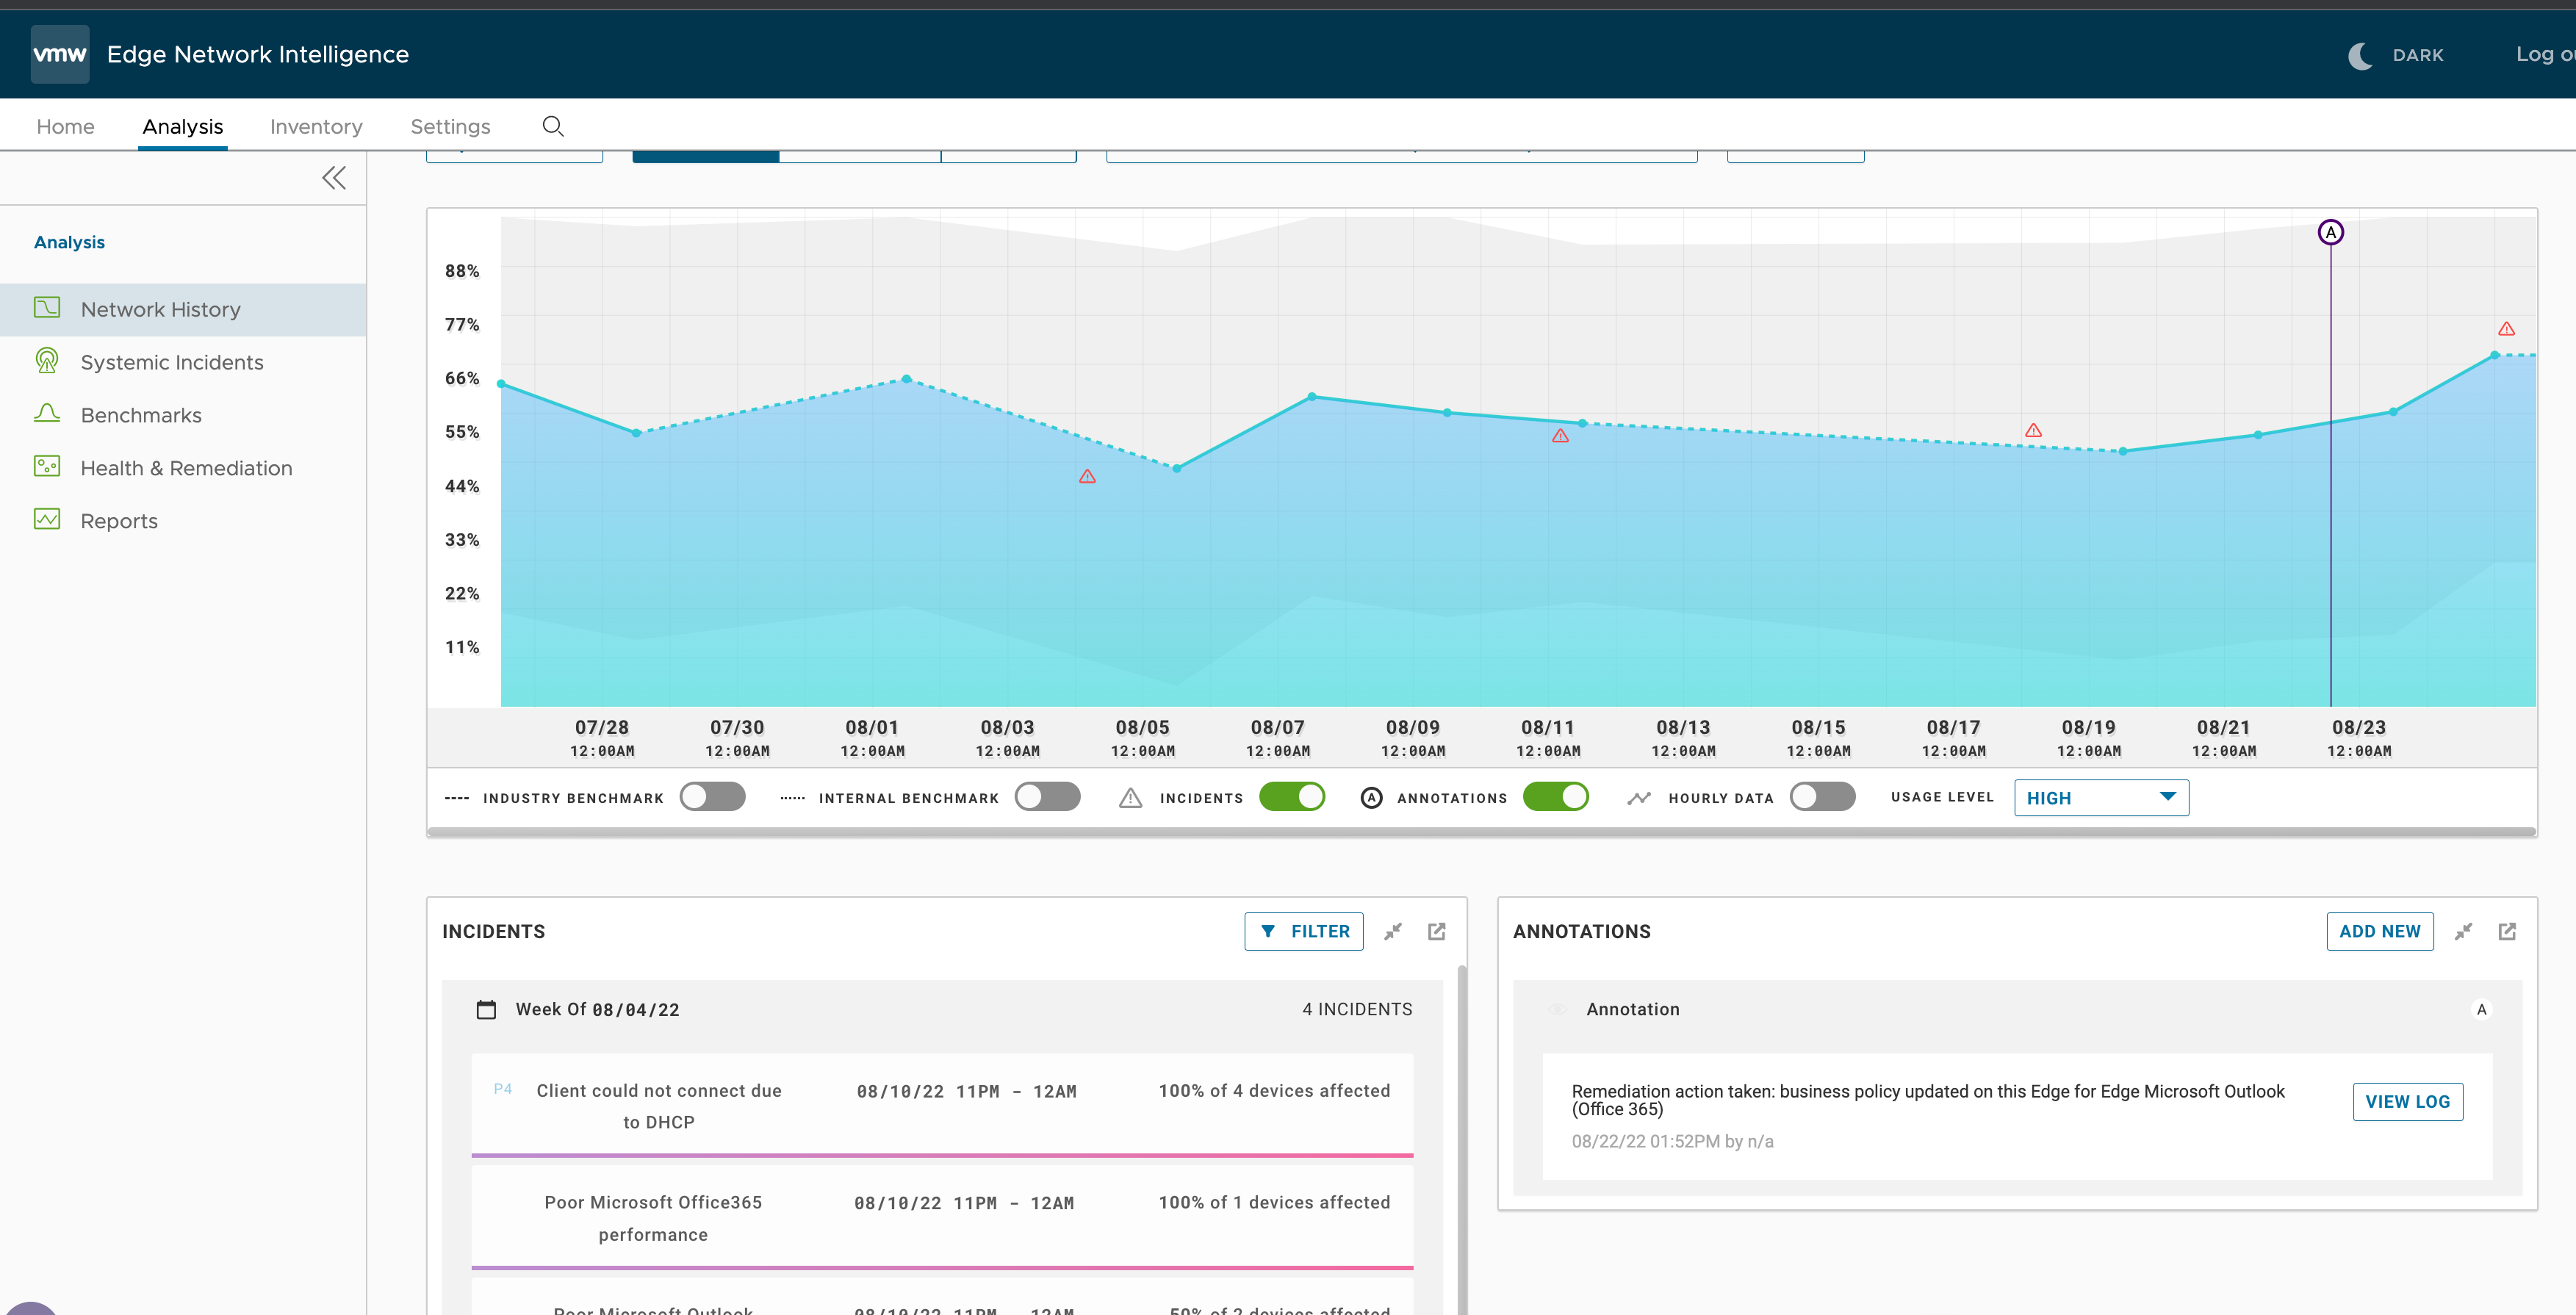
View Annotations for Remediated SD-WAN Edge Events
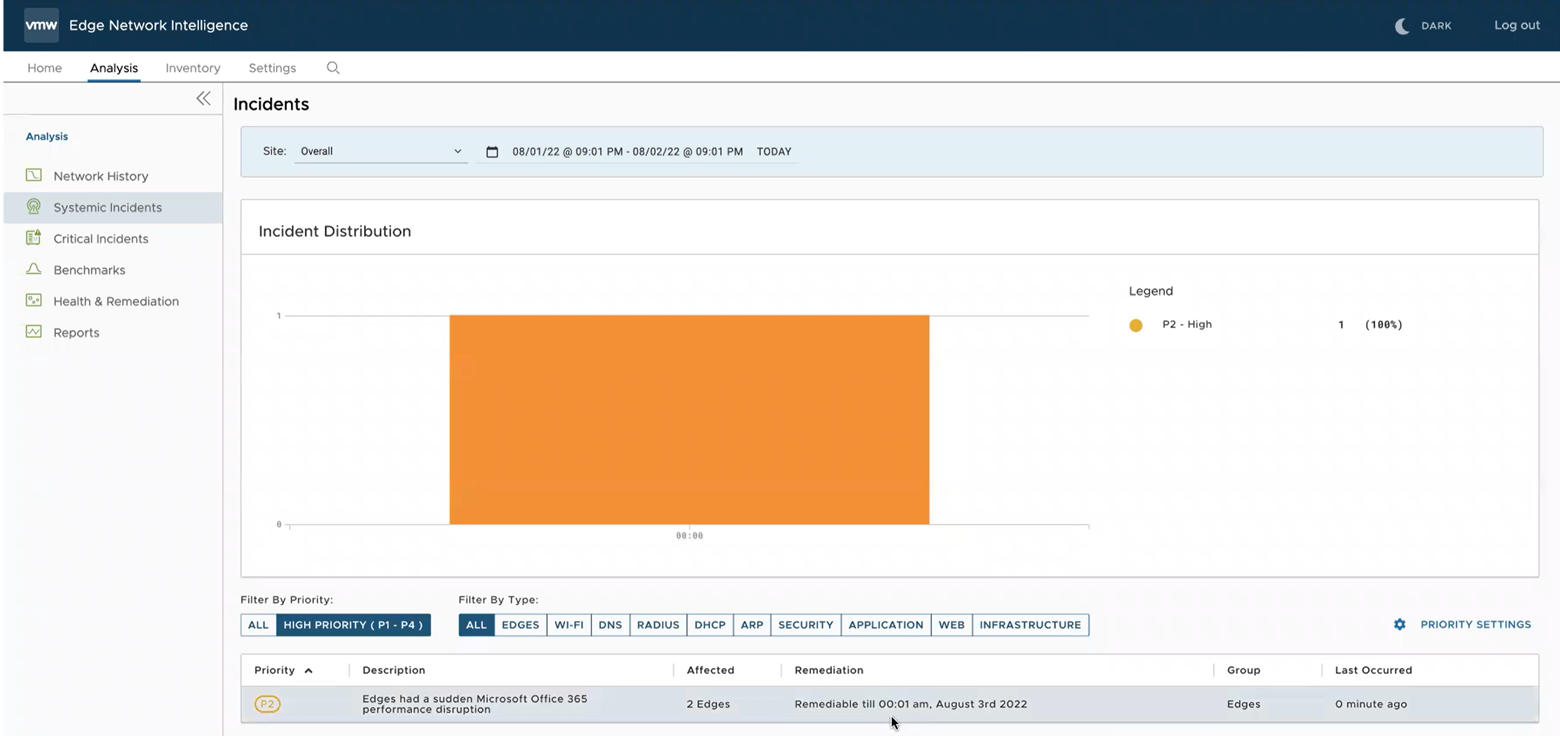
- In the ENI portal, click the Analysis tab.
- From the left menu, select Network History.
- In the Network History page, the Annotations section displays all the annotations (manual and automated) related to SD-WAN Edges.
- You can view remediation logs for the Edges by clicking View Log.
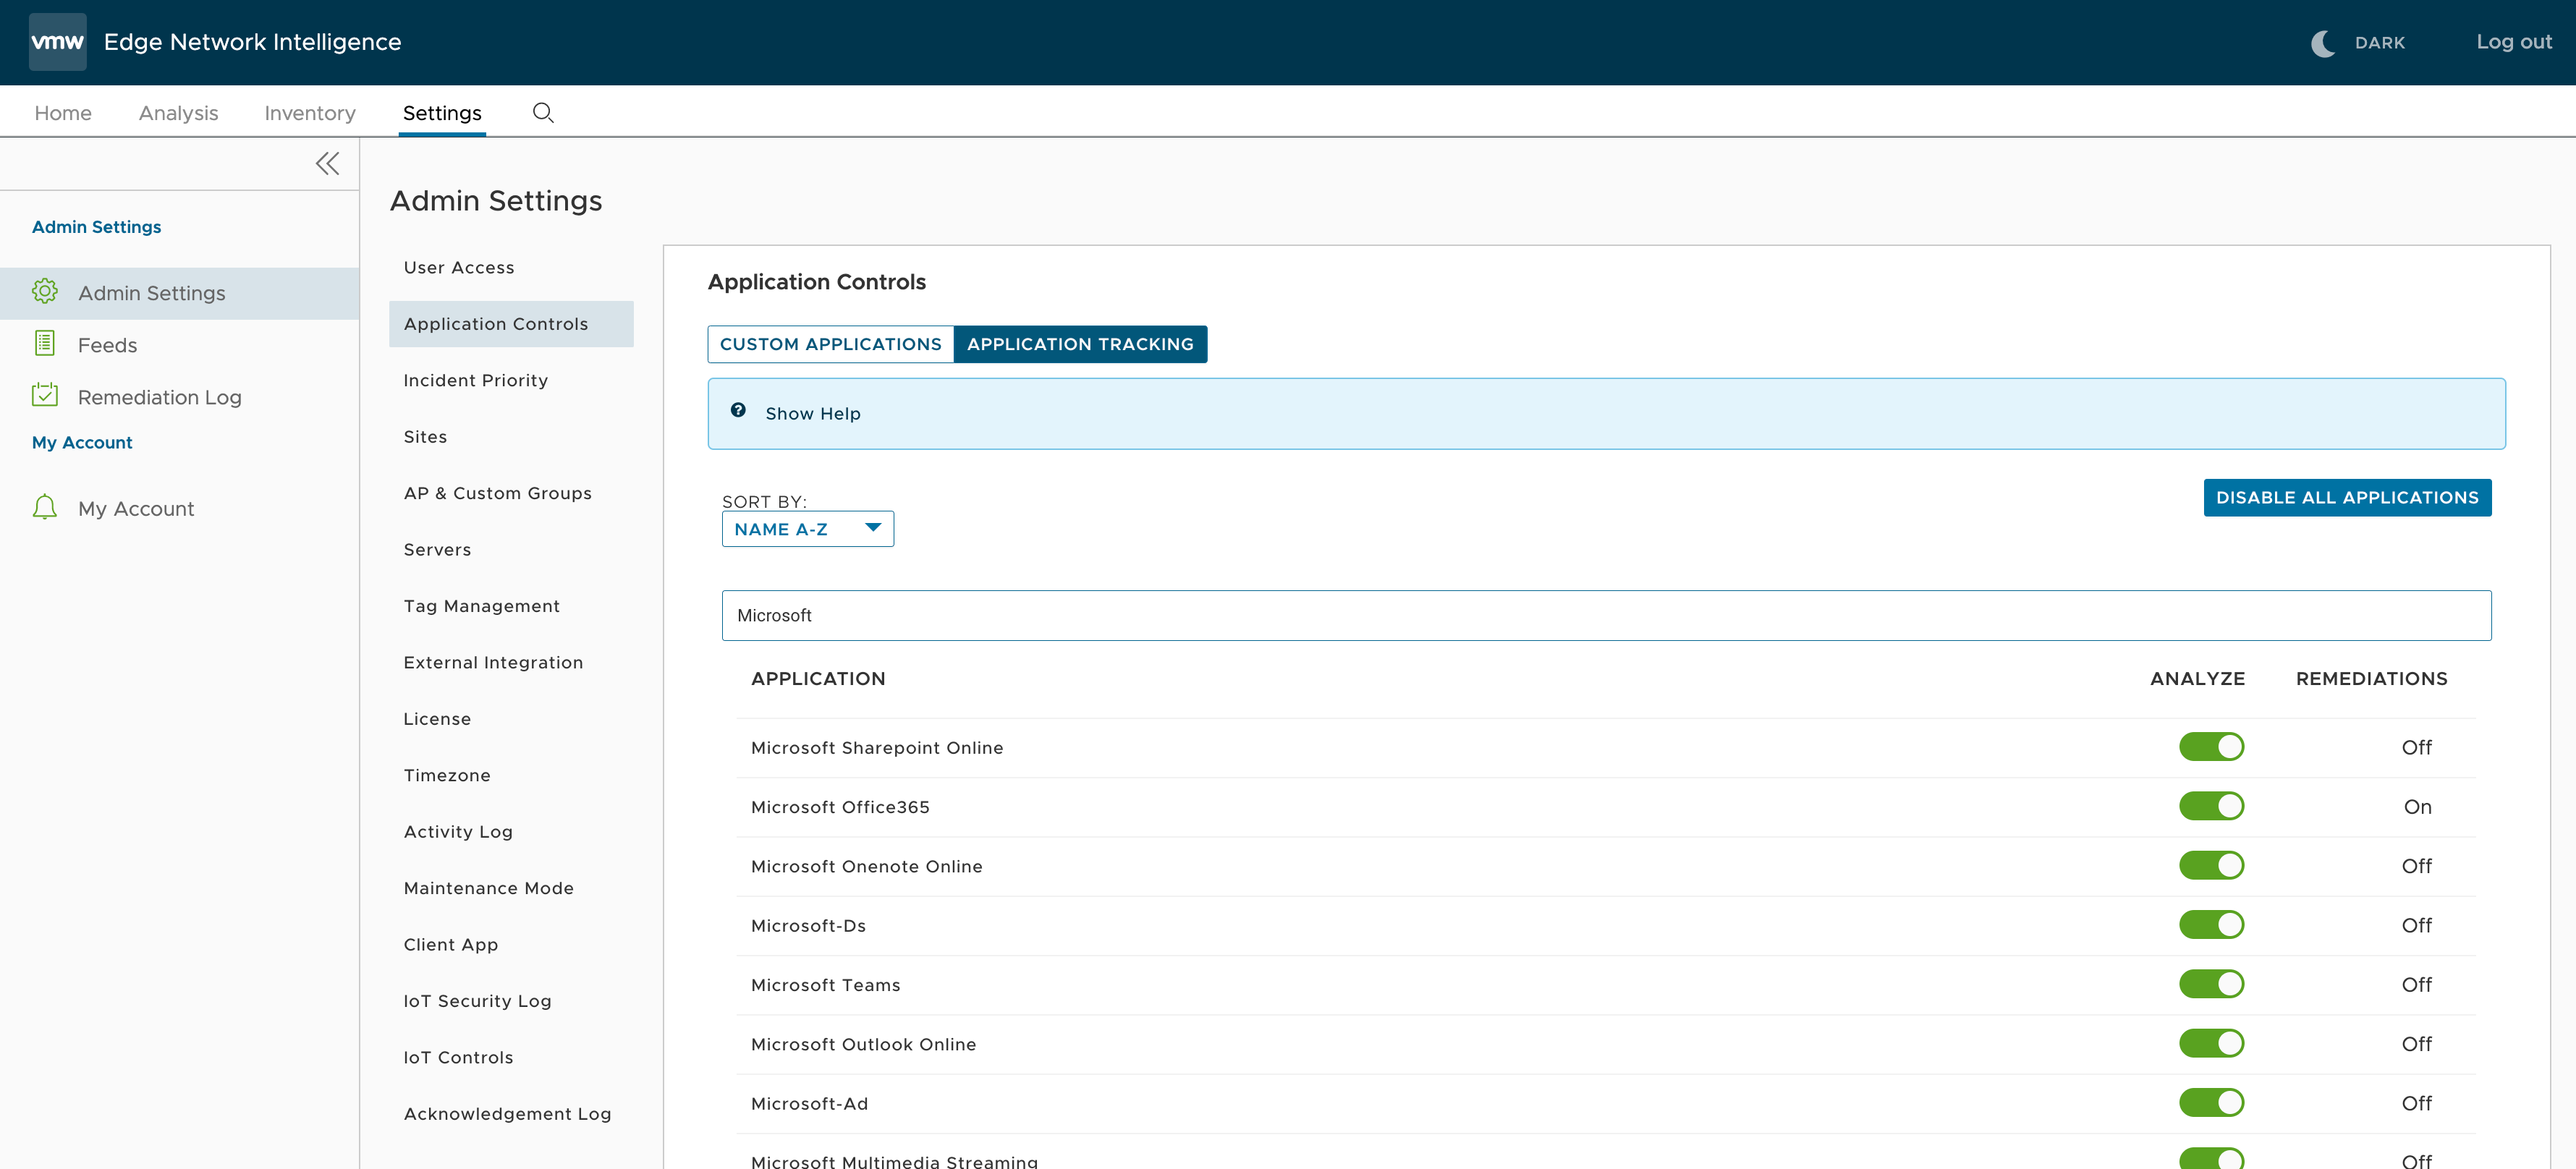
Configure Application Controls and Tracking
You can turn on and off the Tracking feature for the applications from the Admin Settings > Application Controls page. By default, tracking is turned on for all the applications.