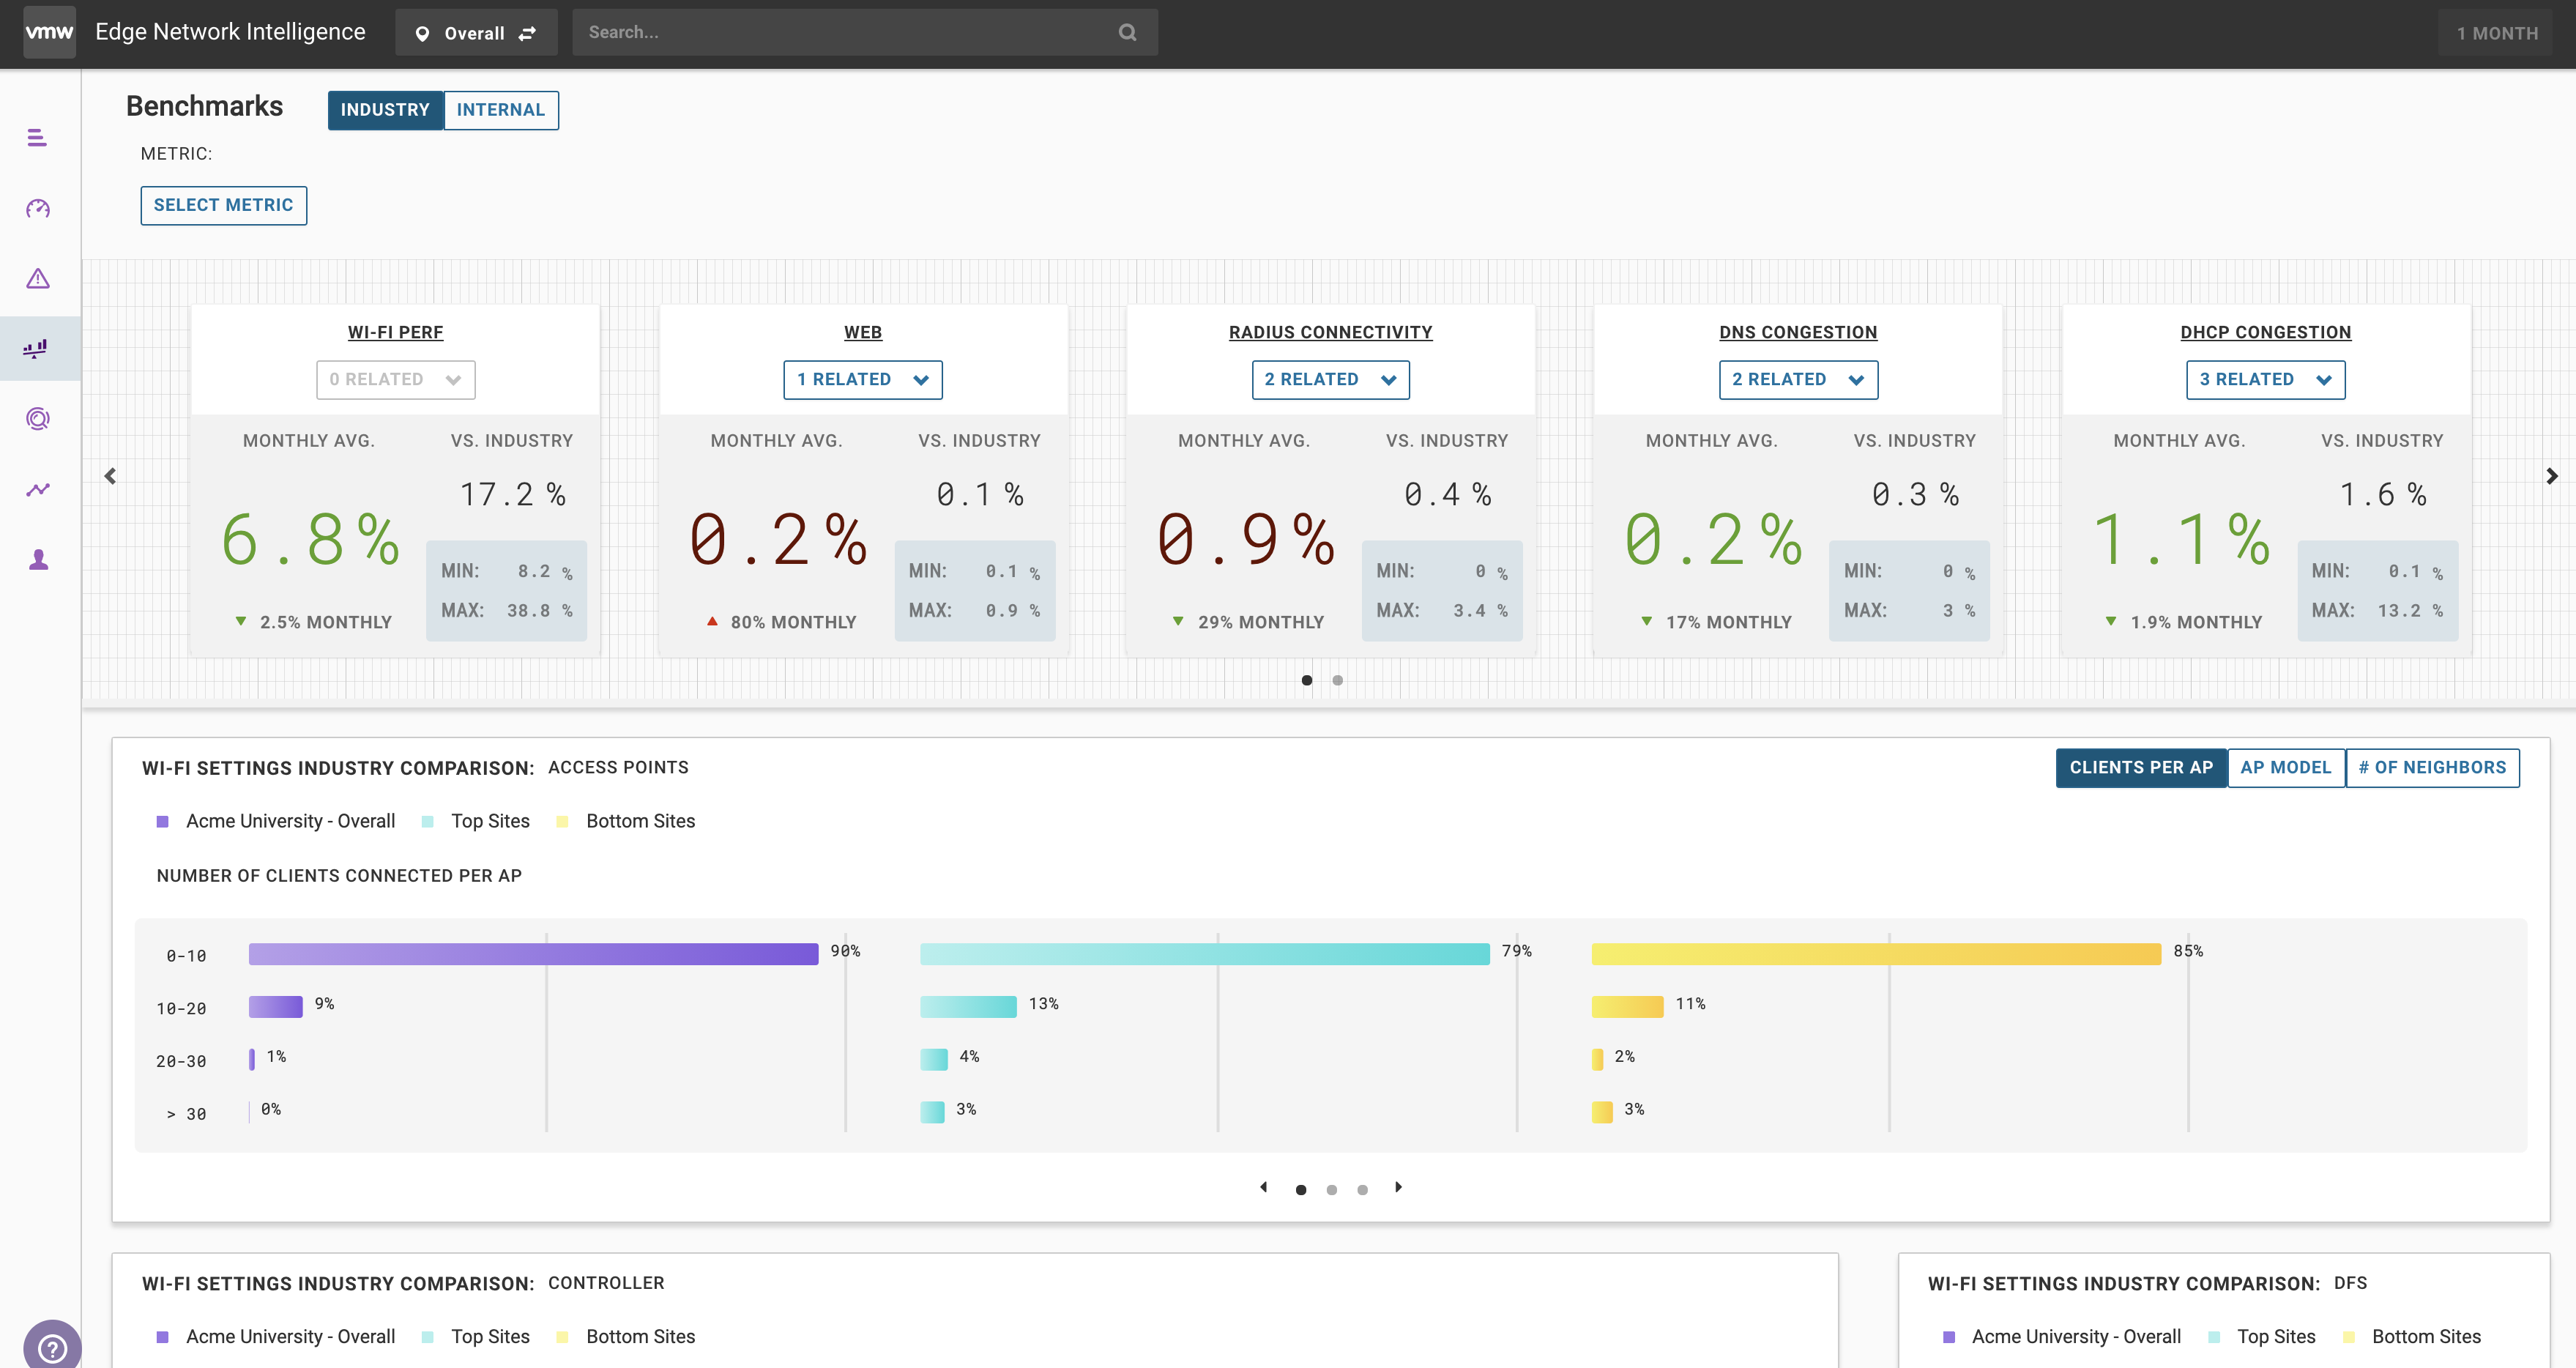
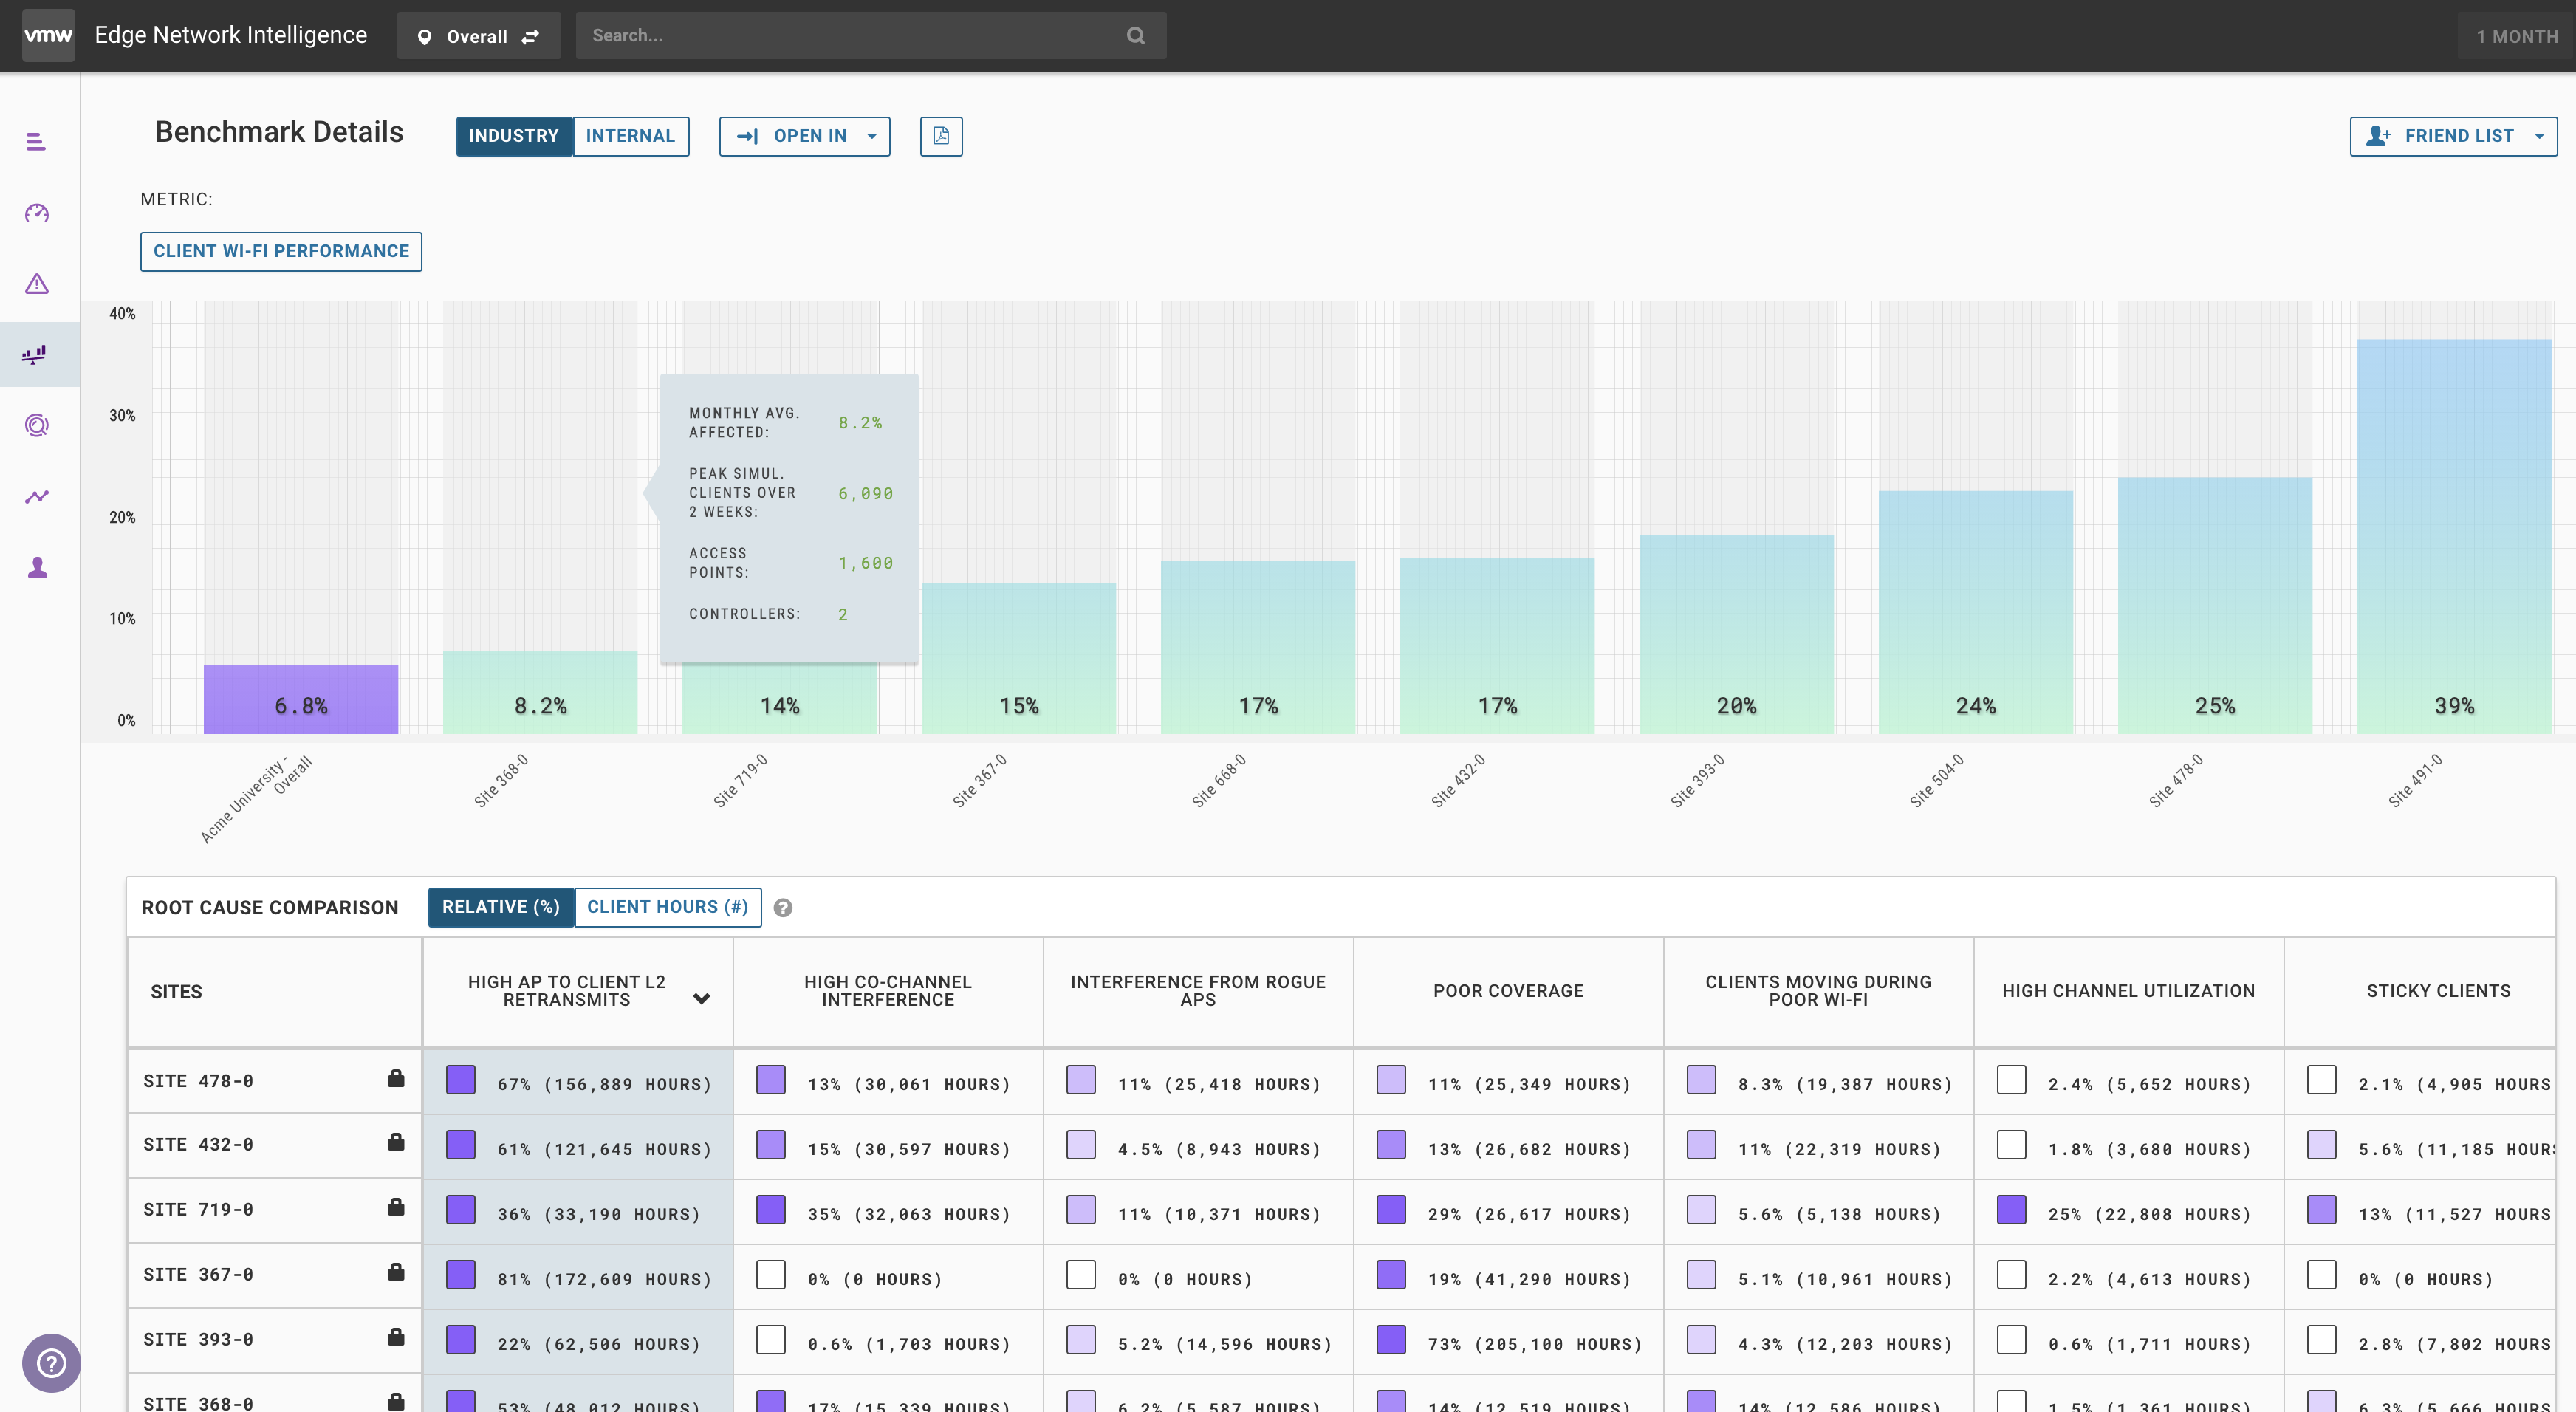
The benchmark page allows you to explore how you compare to other enterprises and dig into the root cause differences between the other sites. It also allows you to compare site to site internally.
One of the biggest challenges many institutions face is understating how they compare to other institutions. The Benchmark page allows you to compare your institution to others or to other internal sits. In addition, it lets you see how your root causes compare to better or worse to other sites.
Industry comparisons take into consideration the size, type of business, AP vendor, and user counts into consideration to improve the apples to apples comparison.
The overview page is a score card on how your worst performing metrics stack up. The benchmark page automatically selects the worst benchmarks and groups them by infrastructure, application, and network services.

