


Configuring Monitoring
This topic explains how to configure monitoring in the VMware GemFire Management Console.
The monitoring feature in the GemFire Management Console allows you to see metrics and statistics for connected clusters. This includes information such as GET and PUT throughput, CPU Utilization percentage, and WAN receiver throughput (when applicable).
For information about monitoring clusters in the GemFire Management Console, see Monitoring Clusters.
Overview
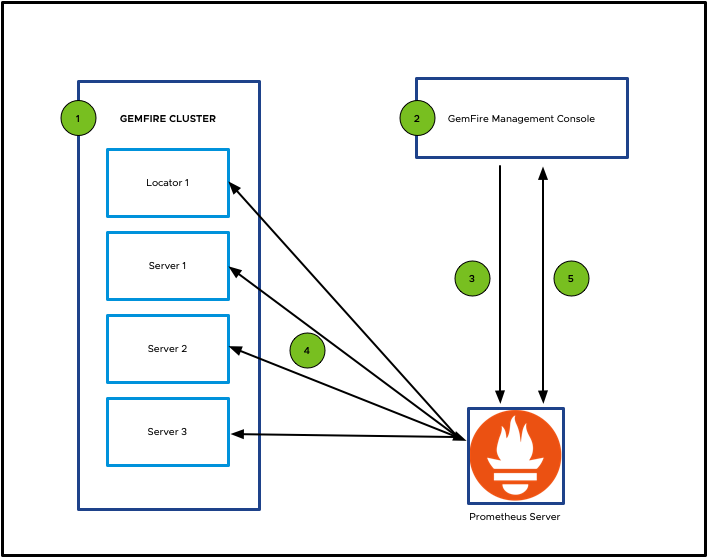
The following diagram shows the flow of inputs and data needed to retrieve metrics from a GemFire cluster to display in the GemFire Management Console.
-
Configure GemFire Metrics: Configure the GemFire cluster to emit metrics for each member.
-
Configure Prometheus Server Connection: Configure the connection from the GemFire Management Console to the Prometheus server.
-
GemFire Member Metrics Host and Port Numbers Sent to Prometheus: Once connected to the Prometheus server, the Management Console sends the GemFire metrics host and port number for each member to the Prometheus server.
-
Retrieve Metrics from GemFire Members: Using the host and port number received from the Management Console, Prometheus retrieves the metrics for each member and stores it in the Prometheus server for up to seven days.
-
Display Cluster Metrics: The Management Console retrieves the cluster metrics from the Prometheus server at specified intervals and displays them on the Monitoring tab.
-
Monitor Graphs: Monitor your data using the graphs in the three primary areas of the monitoring interface:
Configure GemFire Metrics
The steps to enable metrics in a GemFire Cluster depends on the GemFire deployment type. Follow the steps in the section that matches your GemFire deployment type.
GemFire
GemFire 10.1.x+ With the release of GemFire 10.1, the Prometheus metrics jar is now included. To enable metrics collection within a GemFire deployment, users must now must modify the emission setting of emitted metrics for each member. By default, the metrics endpoint is not started on a member if this property is not specified.
For example:
start locator --name=locator1 --port=10334 --J=-Dgemfire.prometheus.metrics.emission=Default
See the GemFire documentation for detailed information on configuring the Prometheus Metrics Endpoint for a GemFire member.
GemFire 9.15.x and GemFire 10.0.x To enable metrics collection within a GemFire deployment, you must add the necessary metrics JAR files to the classpath and specify a unique metrics port for data collection.
-
Metrics JAR files: Add the metrics JAR files to the classpath. The JAR files are included in your VMware GemFire distributions
tools/Modulesdirectory, located in thegemfire-prometheus-metricsdirectory. For example, if your product distribution is located in/myFolder, use the option--classpath=/myFolder/tools/Modules/gemfire-prometheus-metrics/*in thegfshstart locatororstart servercommand. -
Metrics port: Specify a unique metrics port mapping for metrics collection. The metrics port is specified by the Java command-line parameter
gemfire.prometheus.metrics.port. In yourgfshstartcommand, use the option--J=-Dgemfire.prometheus.metrics.port=[port value]to specify the parameter and its value. For example,--J=-Dgemfire.prometheus.metrics.port=7001.Note: When running members on the same host, you must specify a different port number for each member.
Example start locator command:
start locator --classpath=/Path/to/GemFire/Distribution/vmware-gemfire-10.0.1/tools/Modules/gemfire-prometheus-metrics/* --J=-Dgemfire.prometheus.metrics.port=7003
Example start server command:
start server --name=server1 --locators=localhost[10334] --server-port=40404 --classpath=/Path/to/GemFire/Distribution/vmware-gemfire-10.0.1/tools/Modules/gemfire-prometheus-metrics/* --J=-Dgemfire.prometheus.metrics.port=7004
GemFire for Kubernetes
To enable metrics collection within a GemFire for Kubernetes deployment, no additional configuration is necessary. The GemFire for Kubernetes deployment includes the necessary files, and you do not need to add the metrics JAR files to the classpath. The Kubernetes deployment starts the GemFire metrics automatically using metrics port 4321.
GemFire for Tanzu Application Service (TAS)
This feature is not available for GemFire for TAS instances. To monitor metrics in a GemFire for TAS deployment, VMware recommends that you use Tanzu Observability (formerly known as VMware Aria Operations for Applications).
Configure Prometheus Server Connection
The GemFire Management Console seamlessly integrates with a Prometheus server to retrieve and display cluster metrics. You can use either - Embedded Prometheus server. (Available only for OVA and OCI distributions) - External Prometheus server.
Embedded Prometheus Server
This option is exclusively for OVA and Container Image installation types.
With this option, the Management Console automatically starts an embedded Prometheus server. No additional configuration is required.
External Prometheus Server
This option is available for the OVA, Container Image, and JAR file installation types.
To use this option, you must configure both the Management Console and the external Prometheus server.
Configure Management Console
To configure the Management Console to use an external Prometheus server:
-
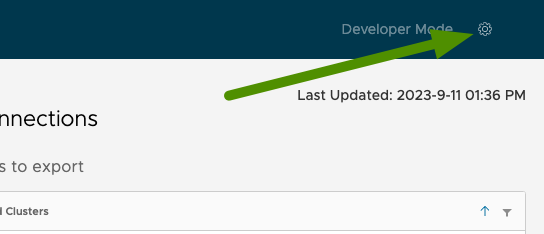
In the upper-right corner of the GemFire Management Console, click the Settings icon:
-
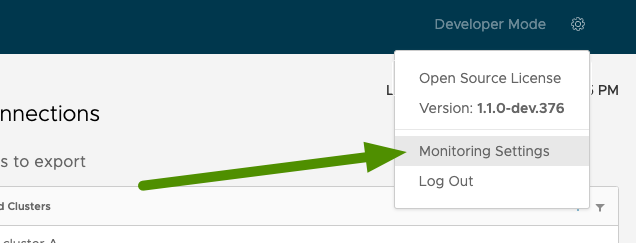
Select Monitoring Settings:
-
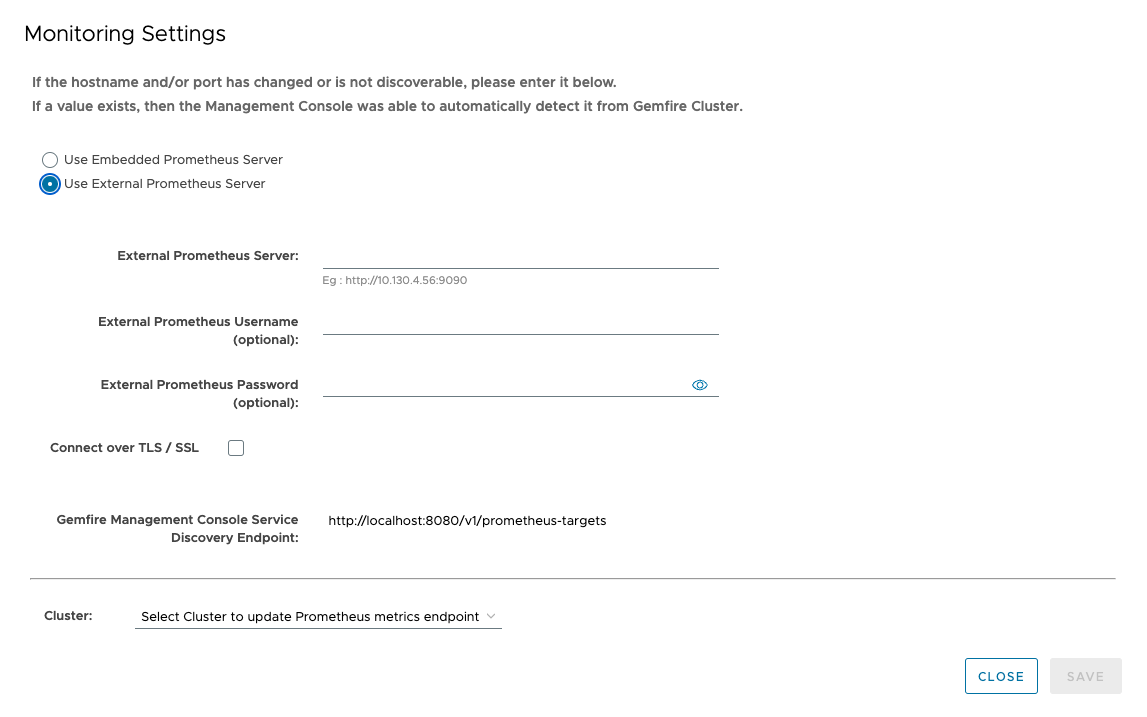
In the Monitoring Settings panel, select Use External Prometheus Server.
-
Record the GemFire Management Console Service Discovery Endpoint. You must specify this endpoint when you configure the external Prometheus server.
-
Enter the hostname or IP address and port number of the external Prometheus server. If necessary, provide the username and password needed to access the external Prometheus server, and configure a TLS/SSL connection.
Configure External Prometheus Server
In your Prometheus server configuration, you must specify the GemFire Management Console Service Discovery Endpoint. This endpoint is displayed in the Monitoring Settings panel, as described in Configure Management Console, above.
This GemFire Management Console Service Discovery Endpoint serves as the source from which the Prometheus server fetches member metric hostnames and port number. For example, when both the Management Console and Prometheus are running on the same host, the URL should resemble the following:
http://localhost:8080/v1/prometheus-targets
If you run Prometheus within a Docker container, below is a sample configuration file that shows how to configure the Prometheus instance.
global:
  scrape_interval: 2s
  scrape_configs:
  - job_name: gmc_clusters
    scrape_interval: 2s
    scrape_timeout: 2s
    http_sd_configs:
    # URL must contain the location from which the targets are fetched.
    - url: "http://localhost:8080/v1/prometheus-targets"
      refresh_interval: 5s
If you run Prometheus as a standalone Docker container, replace “-url:” with the following:
http://host.docker.internal:8080/v1/prometheus-targets
GemFire Member Metrics Host and Port Numbers Sent to Prometheus
Once the GemFire Management Console has successfully connected to the Prometheus server, the Prometheus server uses the GemFire cluster metrics hostname and port number, which are made accessible through the GemFire Management Console Service Discovery Endpoint. This information is essential for establishing connections with GemFire cluster member metrics endpoints.
The Management Console streamlines this process by attempting to auto-fill the hostname and port number for the cluster. In cases where auto-filling encounters an error or if manual adjustments are required, you have the option to update member information within the Monitor Settings panel.
To update cluster information, follow these steps:
-
In the upper-right corner of the GemFire Management Console, click the Settings icon:
-
Select Monitoring Settings:
-
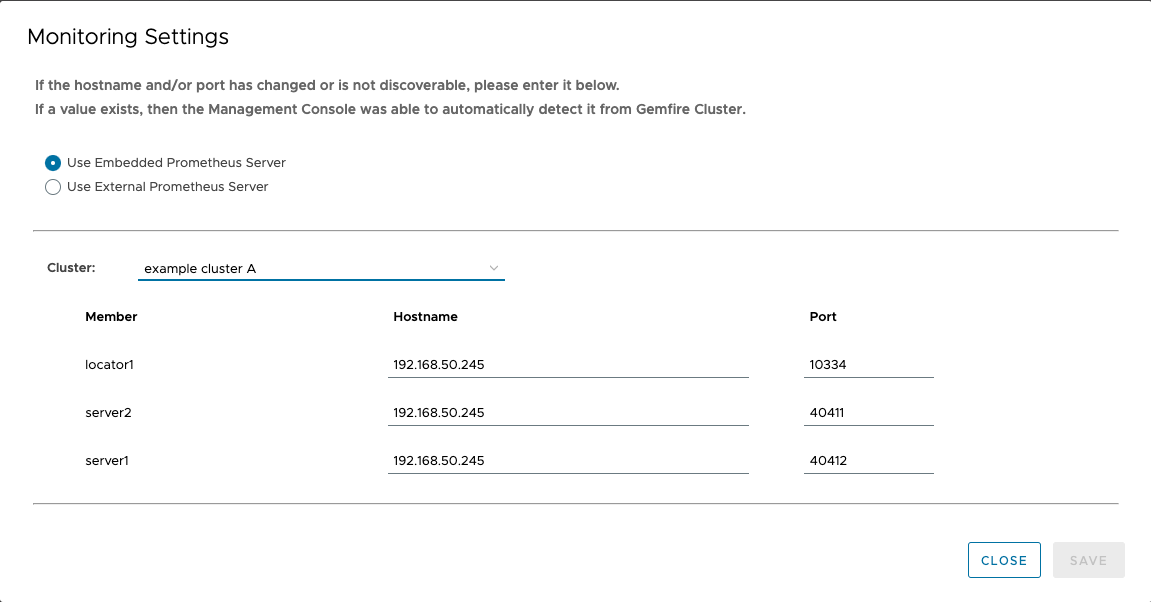
Select a cluster. This populates the form with the cluster members, member hostnames, and metrics ports.
-
Next to Cluster, click Select Cluster to update Prometheus metrics endpoint. Select the cluster to monitor. If necessary, edit the hostnames and ports of the members of your cluster and click Save.
Example:
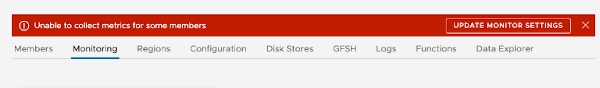
In the event of an issue gathering metrics from a cluster endpoint, a red warning bar will appear in the header area to alert you that the application cannot collect metrics for certain members. Issue may arise due to incorrect cluster hostnames or port numbers for the members of the cluster, or from configuration problems with Prometheus. For detailed troubleshooting and investigation of these issues, refer to the log files of your Management Console installation (../VMware_GemFire_Management_Console/logs), or the Prometheus log files.
Retrieve Metrics from GemFire Members
After all connections are established, Prometheus automatically retrieves metrics from GemFire members at a specified interval, as defined in the Prometheus configuration. The default scrape interval is set to two seconds to ensure that metrics are gathered regularly for monitoring purposes.
The embedded Prometheus server is configured to retain metrics for the last seven days. This data retention period is also reflected in the Monitoring tab of the GemFire Management Console, where you can access a comprehensive 7-day window of historical metrics for analysis and performance tracking.
