


Data Explorer
In the VMware GemFire® Management Console™, the Data Explorer offers two ways to interact with the data in the cluster. On this page, you can either quickly browse within a specified region or run a custom query on the data in the cluster.
Exploring Data
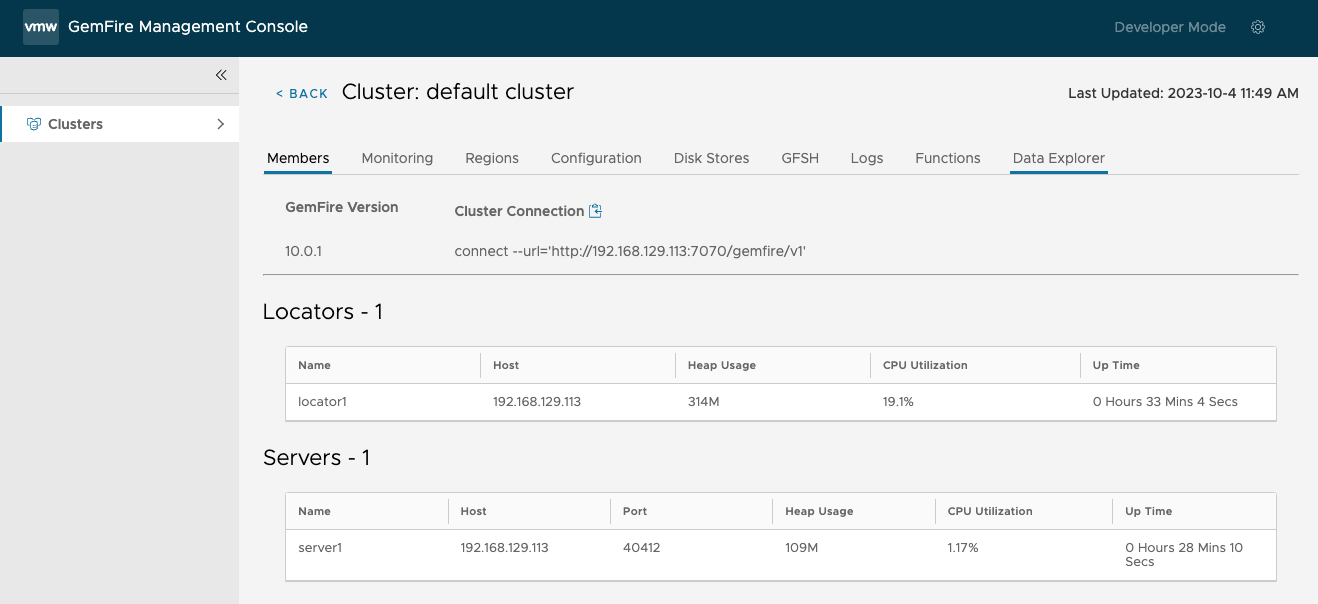
To access the Data Explorer, select a cluster from the Clusters Dashboard. Then select the Data Explorer tab in the horizontal menu bar.
Browse Data
To browse data, choose the Data: Browse radio button and use the drop-down region list to select a region to browse. This runs a select * from /RegionName query on the selected region. Use this to quickly browse a region’s data. 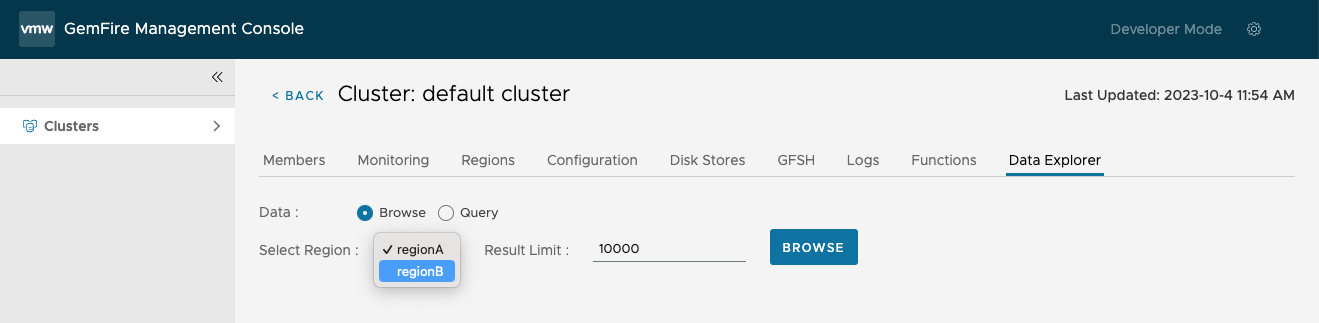
You can specify a Result Limit to restrict the number of matches returned. Then select the Browse button to display the data.
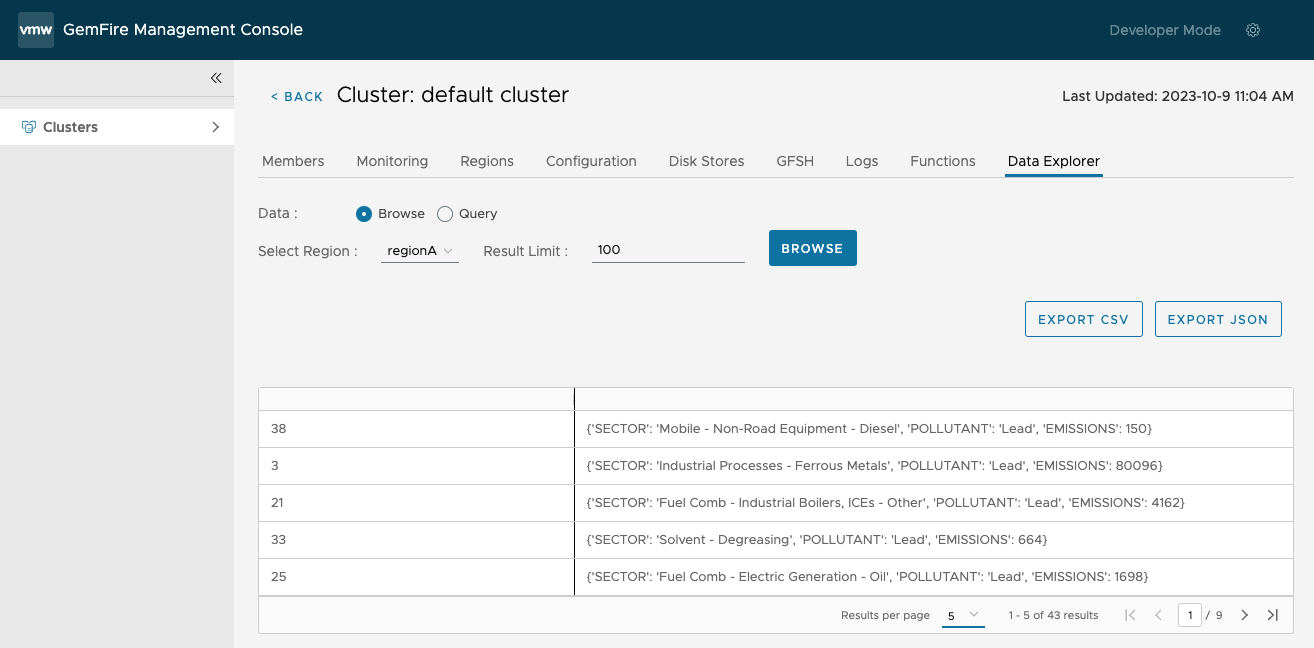
You can export the results as a CSV or JSON file by clicking on either the Export CSV or Export JSON button. This downloads the returned result set in the selected format to your Downloads folder.
Query Data
To query data, select the Data: Query radio button. This provides you with two options: Ad Hoc Queries or Saved Queries.
GemFire uses OQL (Object Query Language) for executing queries, providing a powerful and expressive syntax for querying distributed data. OQL allows users to construct queries using familiar SQL-like syntax, enabling them to manipulate and retrieve data from GemFire’s distributed data grid seamlessly. For examples of GemFire OQL queries, see Querying FAQ and Examples in the GemFire documentation.
Note: The GemFire Management Console has an automatic timeout set for 10 minutes. If your query requires longer than 10 minutes to run, open a terminal and execute the query through the gfsh command shell.
Ad Hoc Queries
With ad hoc queries, users can effortlessly explore the data stored within GemFire, enabling rapid prototyping, troubleshooting, and data analysis tasks. This capability proves invaluable for scenarios requiring quick data retrieval or experimentation with different query parameters, facilitating a streamlined approach to extract insights and drive informed decision-making.
To run an ad hov query, enter the query into the text box and click Run Query. You can specify a Result Limit to restrict the number of matches returned. If you do not enter a Result Limit, the default value of 10,000 is used.
Users have the option to save their ad hoc queries for future use by clicking on the Save Query button. This prompts a dialogue box where users can assign a name to the query, make any necessary adjustments to the text query, and save it for later use.
Saved Queries
Running a Saved Query
To run a saved query:
-
Access Saved Queries: Navigate to the Saved Queries option. A drop-down menu appears containing all saved queries.
-
Select a Query: From the drop-down menu, select the desired query to execute. The query text box is automatically populated with the selected saved query.
-
Execute the Query: After selecting the query, click Run Query to execute the saved query.
Editing a Saved Query
There are two options to modify a saved query:
-
Editing using Dialogue Box: Select the Edit option next to the saved queries drop-down. This opens a dialogue box where you can update the query name, modify the query text, or delete the query entirely.
-
Direct Text Editing: You can directly edit the text in the query text box. To save the updated query, click Save Query. You will be prompted to either overwrite the currently saved query with the updated version or save the modified query as a new one.
Cancel a Running Query (GemFire 10.1+)
When running a query against a GemFire version 10.1 or higher cluster, users can cancel the query. After clicking on the Run Query button, the button is replaced with a Cancel Query button, allowing you to cancel the currently running query.
For more information about managing queries, see Managing Queries in the GemFire v10.1 product documentation.
Recent Queries
This table lists the five most recent queries with the most recent query at the top. Each entry shows the query statement, the number of rows returned, and the query’s execution time in milliseconds. Familiar icons are provided to rerun ( ) the query and to copy (
 ) the query statement to your clipboard.
Export Query Response
Upon executing a query and receiving the results, users have the option to export the query response for further analysis or sharing. The export feature provides users with the flexibility to save query results in either CSV (Comma-Separated Values) or JSON (JavaScript Object Notation) format.
You can export the results as a CSV or JSON file by clicking on either the Export CSV or the Export JSON button. This downloads the returned result set in the selected format to your Downloads folder.
