Logs
In the VMware GemFire® Management Console™, the Logs tab allows users to view and download log files for locators and servers on connected clusters. Use the Logs tab to do the following:
-
View Multiple Log Files side-by-side for comparison purposes
-
Search for Terms like messages, words, dates, or times in log files
Note: The Logs tab is intended for use in development processes, and may be insufficient for trailing production systems experiencing real-life traffic volume.
Logs Overview
GemFire generates comprehensive log files. Use the logging messages within these files to confirm system configuration and debug problems in configuration and code.
For information about GemFire log files and logging, see the following topics in the GemFire product documentation:
- How GemFire Logging Works
- Understanding Log Messages and Their Categories
- Naming, Searching, and Creating Log Files
- Set Up Logging
- Advanced Users—Configuring Log4j 2 for GemFire
View a Log File
Every member of a cluster, including servers and locators, generates their own log file. When viewing a log file it is important to remember that log files are displayed in reverse-chronological order.
To view a log file for a member:
-
Open the Logs tab.
-
Click the drop-down arrow.
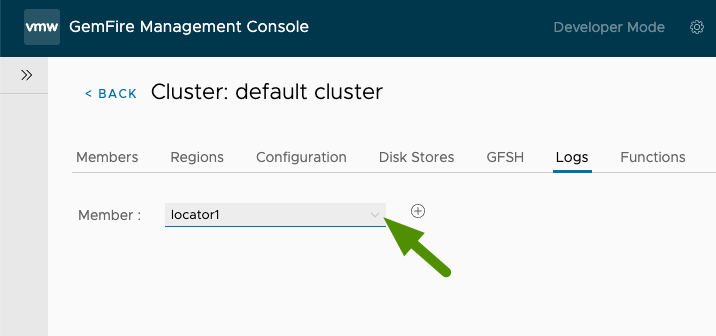
-
Select the name of the member.
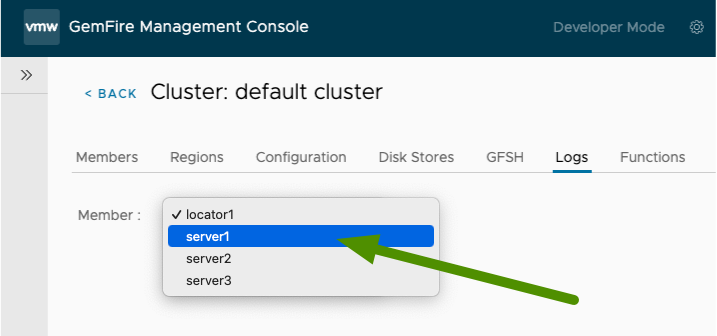
-
Click the add log icon to add the log to your current view.
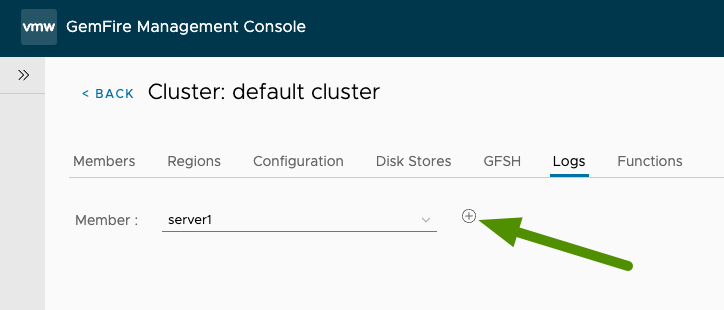
-
View the log file for the member that you selected. Logs are displayed in reverse-chronological order.
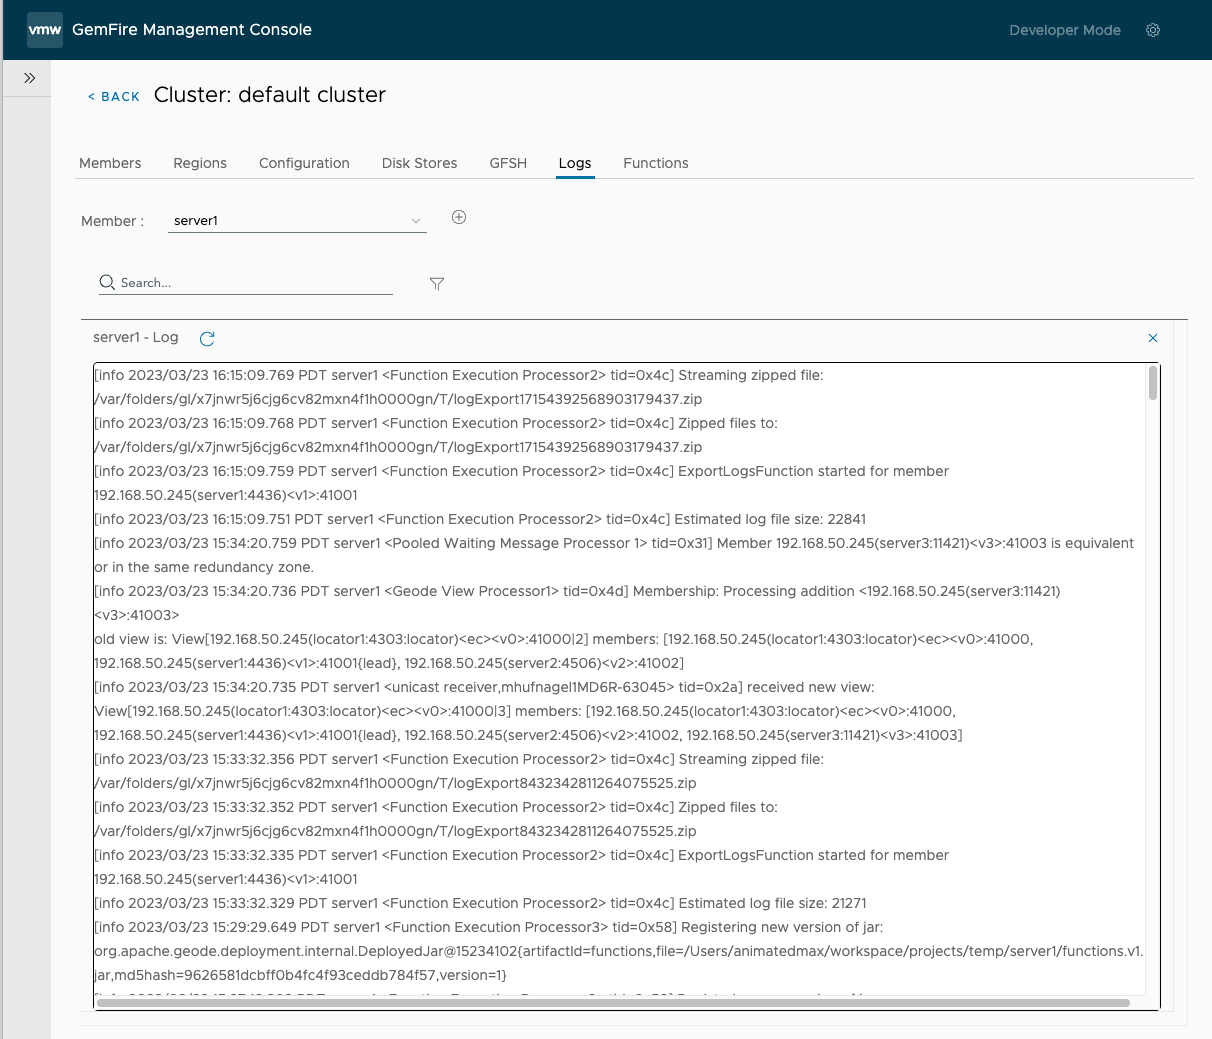
View Multiple Log Files
You can view and search in multiple log files simultaneously.
To view a log file for another member:
-
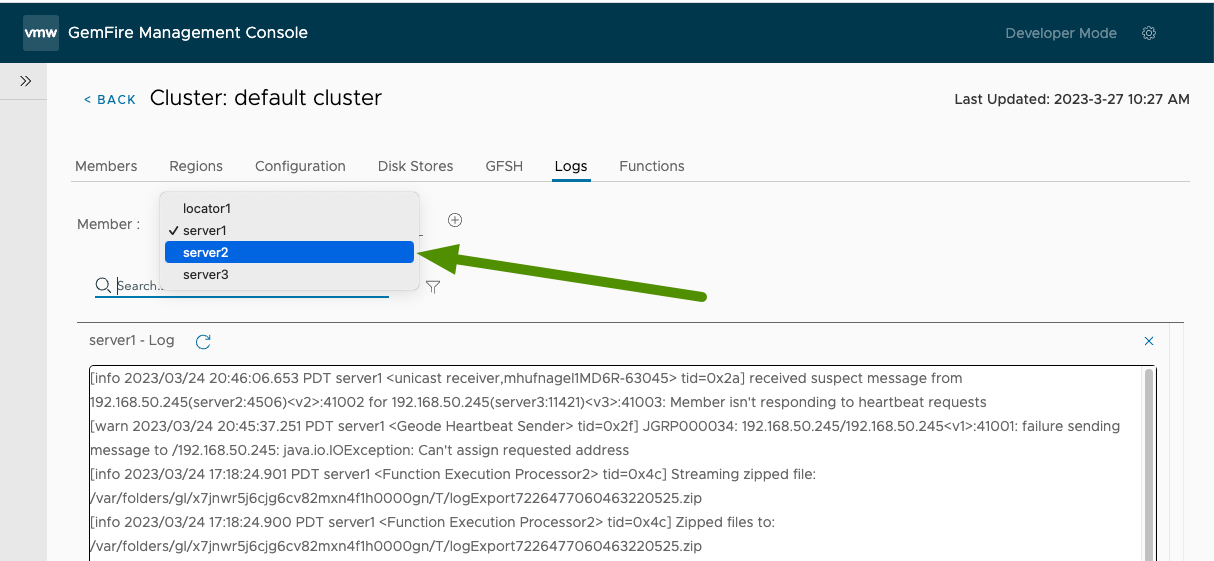
With the log file for the first member displayed in the Logs tab, click the drop-down arrow and select the name of another member.
-
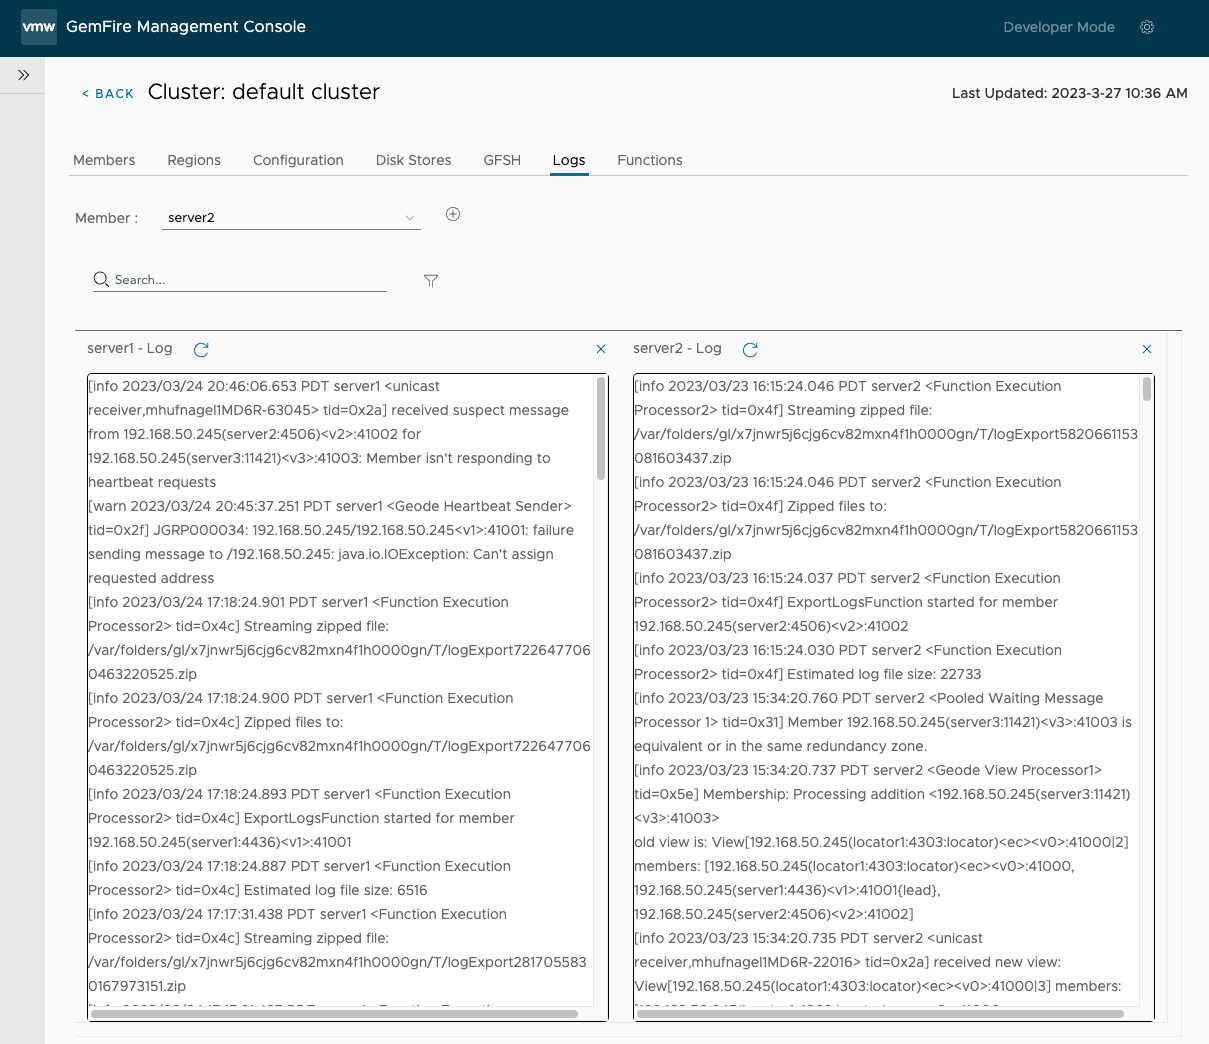
Click the add log icon to add the second log to your current view.
-
View the log file for the both members that you selected.
-
Repeat to add log files for additional members.
Search and Filter
You can search and filter log files for specific terms, by log level, and by date.
Search for Terms
To search log files for specific terms like messages, words, dates, or times:
-
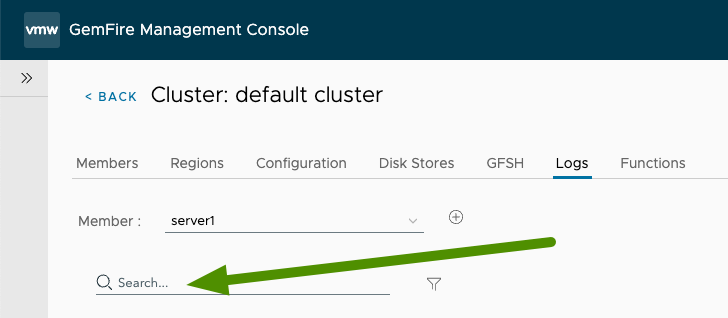
Enter the term in the search terms field.
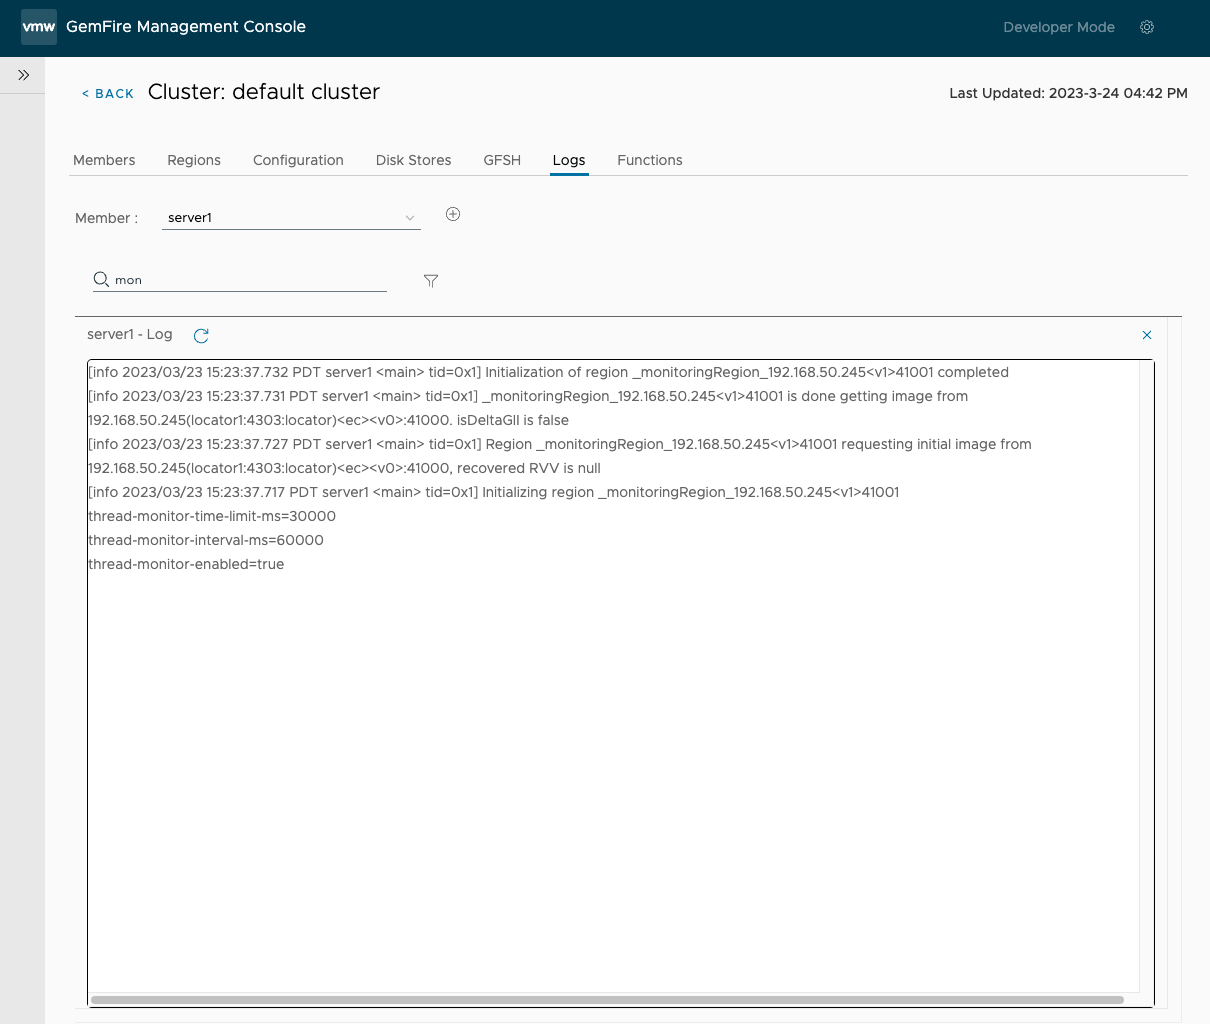
The display dynamically changes to show only the log lines that contain the entered text.
Filter Log Files by Log Level and Date
You can filter log files to display only those matching a particular log level, those occurring within a specific range of dates, or both. For example, you can filter logs to show:
- All
FATALentries - All entries within the last week
- Only the
FATALentries that were logged within the last week
To filter log files by log level and date:
-
Click the filter icon.
-
(Optional) Select a log level.
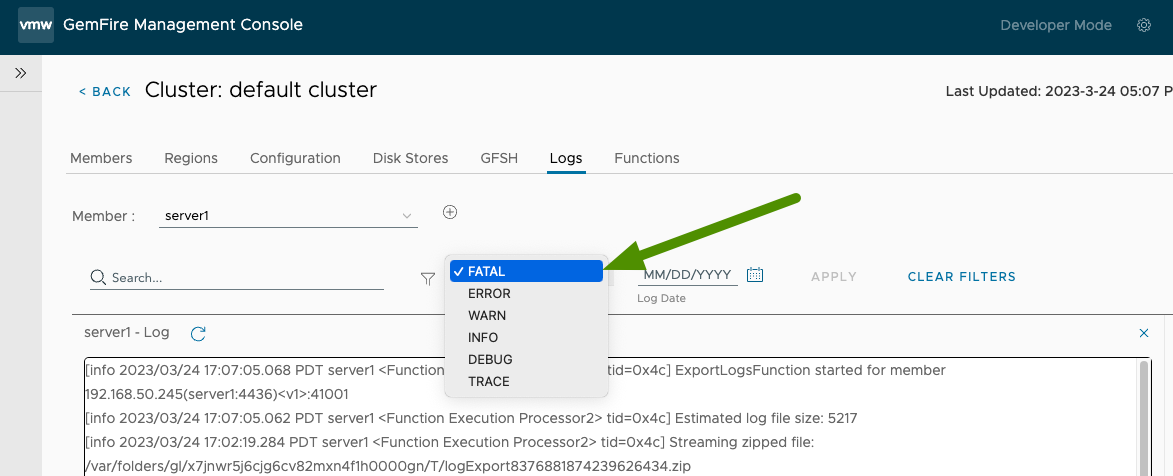
-
(Optional) Select a date.
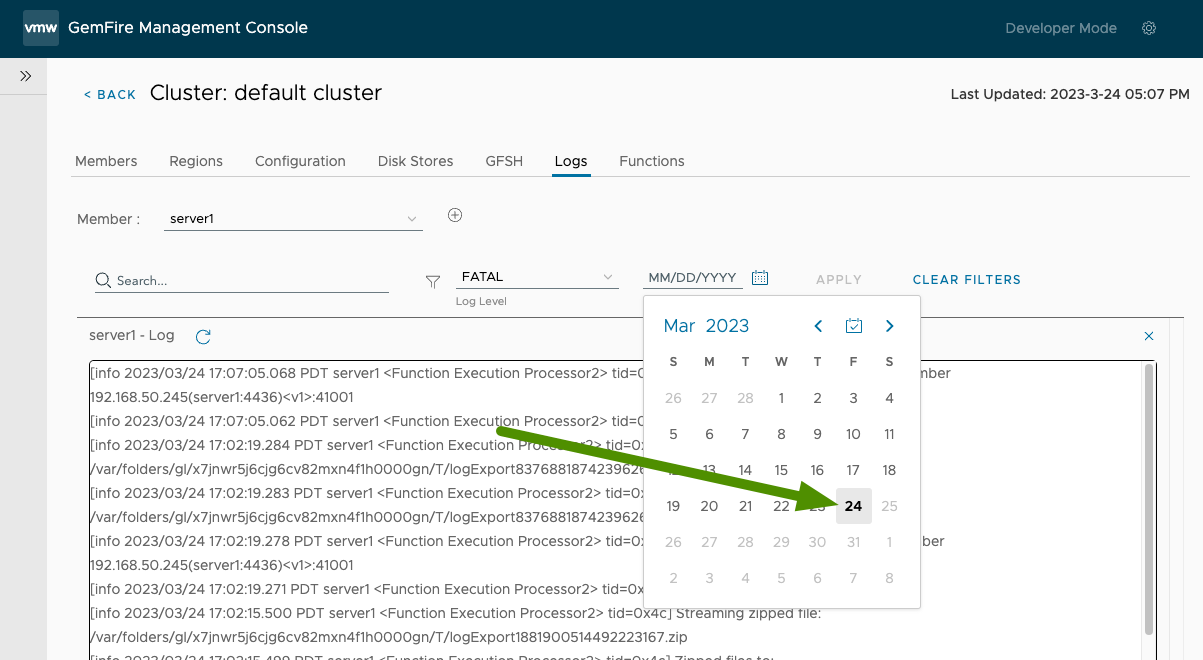
-
Click Apply. The display changes to show only the log lines that match the selected log level and date.
Download Logs and Statistics
You can download log files and statistics about the members of a connected GemFire cluster.
-
Open the Logs tab.
-
Click Download to open the Download Logs and Stats pane.
-
For Export, select one of the following export types:
- Logs and Stats
- Logs Only
- Stats Only
-
(Optional) Use the Start Date/Time and End Date/Time controls to specify a date and time range for the logs and statistics to download. If left blank, all available logs and statistics are downloaded.
-
For Log Level, select a log level and either Minimum or Exact Match. These filtering options determine which logs are downloaded.
- Minimum: Filter set to log entries that meet or exceed the minimum log level specified. Options include
INFO,WARN,ERROR, and others. - Exact Match: Filter set to log entries that match the log level specified exactly.
- Minimum: Filter set to log entries that meet or exceed the minimum log level specified. Options include
-
For Members, select one or more GemFire members from the list.
-
Click Download to download the logs and statistics as you have specified and filtered in the above steps.
Note: If your clusters contains many members and days worth of logs and statistics files, you may want to download smaller files by filtering logs by one member at a time or by specifying a limited date and time range.
The downloaded data is saved as a .zip file in your computer’s “Downloads” folder. Locate and open the .zip file in your computer’s “Downloads” folder to access the individual log and statistics files. These files are organized by GemFire members.