The Visual Statistics Display (VSD) utility reads VMware Tanzu GemFire for Tanzu Application Service statistics and produces graphical displays for analysis. VSD helps you monitor the performance of GemFire for Tanzu Application Service and diagnose performance problems.
Your service instance creates a statistical archive file named filename.gfs. The file logs useful statistics — counters and gauges that describe the state of the system at a particular moment in time. The file collects statistics at specific sampling intervals, which you can set at various levels to monitor different types of behavior.
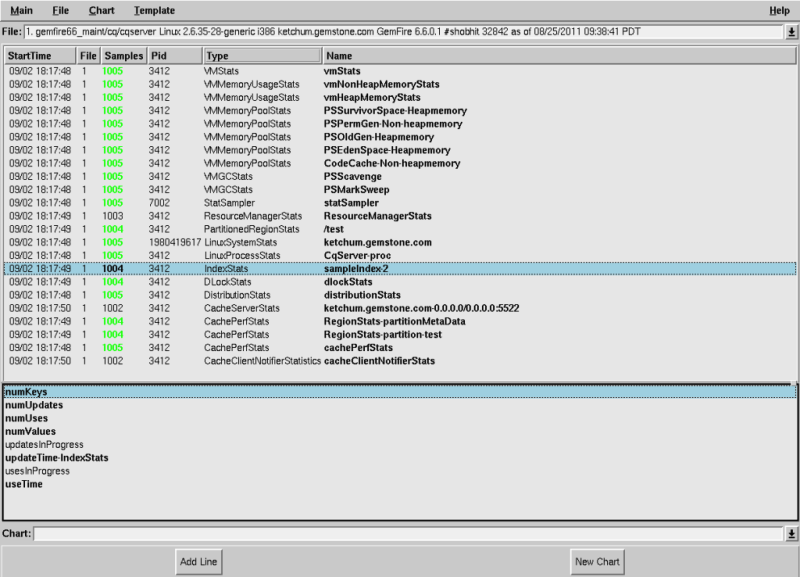
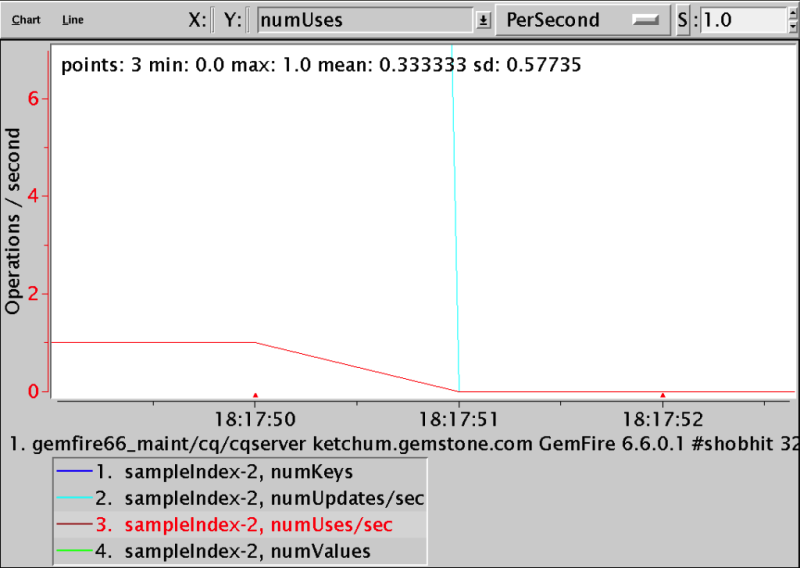
The VSD tool reads the sampled statistics and produces graphical displays for analysis. Typically, the points on a line of a VSD graph represent the values for a particular statistic over time. VSD’s online help offers more complete reference information about the tool.
The following screenshots of the VSD tool display statistics and a graph analysis of selected statistics.