


This topic discusses VMware GemFire integration with Tanzu Observability (formerly known as VMware Aria Operations for Applications).
The VMware GemFire metrics module provides out-of-the-box integration with VMware Aria Operations for Applications (formerly named Tanzu Observability by Wavefront). The metrics module, provided as a collection of JAR files in your product release, adds a metrics endpoint to a specified GemFire member.
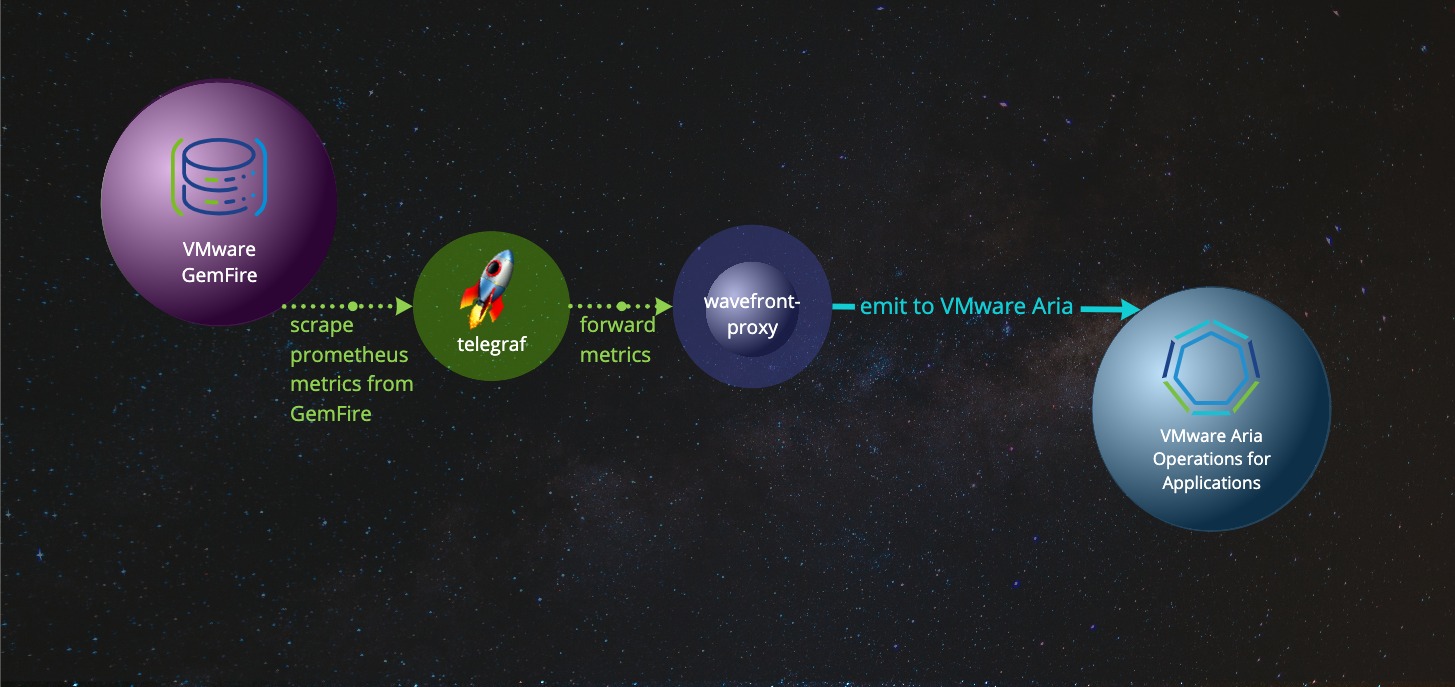
By default, this Prometheus-style endpoint hosts approximately 200 GemFire metrics at an update interval of one minute. These metrics can be scraped by a metrics collection agent (such as Telegraf) and forwarded to a metrics monitoring platform (such as Aria) for further analysis and alerting.
Delivering GemFire Metrics via Telegraf and VMware Aria Proxy to Tanzu Observability
To enable VMware Aria-viewable metrics across your Tanzu GemFire cluster:
- To modify the default settings for number of emitted metrics or their refresh rate, do so by setting a system-wide environment variable.
- For each member to monitor, enable VMware Aria-viewable Prometheus-style metrics when you create the member.
Configure GemFire Metrics
By default, each metrics endpoint hosts approximately 200 metrics at an update interval of one minute.
You can optionally configure the emission dataset and its update interval using the GEMFIRE_METRICS environment variable, which defines the emission and interval parameters using JSON syntax.
Setting GEMFIRE_METRICS is optional. If you set GEMFIRE_METRICS, the configuration must be in place before you start the member to which it applies.
The emission parameter specifies the quantity of data to export:
| Syntax | Value | Example |
|---|---|---|
| "emission" : "value" | Default: Emit approximately 200 metrics All: Emit all GemFire metrics None: No metrics will be available on the endpoint |
"emission" : "All" |
The interval property is used in computing certain windowed statistics. To get the most out of windowed statistics, align this interval to be close to your scrape interval. When set, this value overrides the default interval of one minute. An accepted value is a positive integer followed by a unit specifier:
- s for seconds
- m for minutes
- h for hours
- d for days
- w for weeks
For example, 4m is four minutes, and 90s is 90 seconds.
Note: When emission is set to All, the default for interval becomes 2s, unless you specify otherwise.
| Syntax | Value | Units | Examples |
|---|---|---|---|
| "interval" : "value" | positive integer followed by a unit | s seconds m minutes d days w weeks |
"interval" : "4m" "interval" : "90s" |
Sample usage:
export GEMFIRE_METRICS='{"emission": "All", "interval":"90s"}'
Enable VMware Aria-Viewable Metrics
To enable VMware Aria-viewable Prometheus-style metrics for a member (a Tanzu GemFire locator or server), you must provide the following information when you create the member:
-
Metrics JAR files: Add the metrics JAR files to the classpath. The JAR files, located in the
gemfire-prometheus-metricsdirectory, are included in your Tanzu GemFire distribution’stools/Modulesdirectory. For example, if your product distribution is located in/gemfire, use the option--classpath=/gemfire/tools/Modules/gemfire-prometheus-metrics/*in the gfshstart locatororstart servercommand. -
Metrics port: Specify a unique metrics port mapping for each locator and server. The metrics port is specified by Java command-line parameter
gemfire.prometheus.metrics.port. In your gfshstartcommand, use the--J=-D<param>=<value>option to specify the parameter and its value. For example,--J=-Dgemfire.prometheus.metrics.port=7001.
-
To enable VMware Aria-viewable metrics for a locator by adding the metrics JAR files to the classpath and specifying a metrics port, run the following
gfshcommand. If theGEMFIRE_METRICSenvironment variable is set, the metrics endpoint incorporates it into the member configuration.gfsh -e "start locator --classpath=/gemfire/tools/Modules/gemfire-prometheus-metrics/* \ --J=-Dgemfire.prometheus.metrics.port=7001" -
After the member has started, locate and record the IP address of the member in the output of the
startcommand. For example, in the sample output below, the IP address is192.168.50.245:gfsh>start locator --classpath=/gemfire/tools/Modules/gemfire-prometheus-metrics/* --J=-Dgemfire.prometheus.metrics.port=7001 Starting a Tanzu GemFire Locator in /Users/username/my_gemfire/locator1... ................. Locator in /Users/username/my_gemfire/locator1 on 192.168.50.245[10334] as locator1 is currently online. Process ID: 4580 Uptime: 10 seconds Tanzu GemFire Version: 10.0 Java Version: 1..0_361 Log File: /Users/username/my_gemfire/locator1/locator1.log JVM Arguments: -Dgemfire.enable-cluster-configuration=true -Dgemfire.load-cluster-configuration-from-dir=false -Dgemfire.launcher.registerSignalHandlers=true -Djava.awt.headless=true -Dsun.rmi.dgc.server.gcInterval=9223372036854775806 Class-Path: /Users/username/vmware-gemfire-10.0/lib/gemfire-core-1.15.0.jar:/gemfire/tools/Modules/gemfire-prometheus-metrics/gson-2.8.6.jar:/gemfire/tools/Modules/gemfire-prometheus-metrics/gemfire-prometheus-metrics-0.1.0-build.86.jar:/gemfire/tools/Modules/gemfire-prometheus-metrics/micrometer-registry-prometheus-1.6.3.jar:/gemfire/tools/Modules/gemfire-prometheus-metrics/simpleclient_common-0.9.0.jar:/gemfire/tools/Modules/gemfire-prometheus-metrics/simpleclient-0.9.0.jar:/Users/username/vmware-gemfire-10.0/lib/geode-server-all-1.15.0.jar Successfully connected to: JMX Manager [host=192.168.50.245, port=1099] Cluster configuration service is up and running. -
Verify that the metrics module is properly configured by visiting the following URL:
http://HOSTNAME:PORT/metricsWhere:
- HOSTNAME is the IP address of the member that you recorded in a previous step.
- PORT is the metrics port that you specified with the command-line parameter
gemfire.prometheus.metrics.portin a previous step.
Using the example information above, this would be:
http://192.168.50.245:7001/metrics.The output should resemble the following:
# HELP gemfire_replyWaitTime
# TYPE gemfire_replyWaitTime gauge
gemfire_replyWaitTime{category="DistributionStats",instance="distributionStats",member="192.168.
129.137(locator1:76435:locator)<ec><v0>:41000",} 0.0
# HELP gemfire_loadsCompleted
# TYPE gemfire_loadsCompleted gauge
gemfire_loadsCompleted{category="CachePerfStats",instance="RegionStats-managementRegionStats",member="192.168.129.137(locator1:76435:locator)<ec><v0>:41000",} 0.0
gemfire_loadsCompleted{category="CachePerfStats",instance="cachePerfStats",member="192.168.129.137(locator1:76435:locator)<ec><v0>:41000",} 0.0
...
Example
The following example enables VMware Aria-viewable metrics on a single GemFire locator, then shows how to scrape metrics using Telegraf and view the results using VMware Aria. The example uses the MacOS-specific brew command. You may need to adapt it for use on other platforms.
The example configuration contains two main parts:
- GemFire setup
- Telegraf and VMware Aria Proxy setup (metrics collection agent and forwarder)
GemFire Setup
The example requires that some GemFire metrics be enabled from a gemfire.properties file.
-
Create a file named gemfire.properties with the following content:
statistic-sampling-enabled=true statistic-archive-file=stats.gfs enable-time-statistics=true -
To simplify command lines, set two environment variables to the paths for use in the code snippets below. Paths shown here are placeholders. Substitute the paths that match your system.
METRICS_PATH="~/gemfire/tools/Modules/gemfire-prometheus-metrics/*"
GEMFIRE_PROPERTIES_FILE_PATH="./gemfire.properties"
With these configuration parameters in place, you can start GemFire using gfsh.
Example GemFire Startup Using gfsh
gfsh -e "start locator --name=locator1 --port=10334 \
  --classpath=$METRICS_PATH \
  --properties-file=$GEMFIRE_PROPERTIES_FILE_PATH \
  --J=-Dgemfire.prometheus.metrics.port=7001"
Telegraf and VMware Aria Proxy Setup
This example uses Telegraf as the agent to pull VMware Aria-viewable Prometheus-style metrics from the GemFire cluster. It sends them to a local VMware Aria proxy, which forwards them to the VMware Aria service.
Install Telegraf and the VMware Aria Proxy, as described on the VMware Aria website:
Acquire an API token that authenticates communication from the VMware Aria Proxy. Follow the directions at Generating an API Token.
Configuring Telegraf
Once installed, add the following inputs.prometheus section to your to your telegraf config file with your selected tags and the URL to your metrics endpoints that you’ve collected in the “Enable VMware Aria-Viewable Metrics” step. Your telegraf config should now resemble:
a config file with the specified tags and the urls to indicate to Telegraf to scrape metrics from GemFire’s prometheus-style endpoints. Here, the configuration file is named “tanzu-gemfire.conf”:
# Telegraf config to scrape GemFire metrics
[agent]
  interval = "10s"
[[inputs.prometheus]]
  urls = ["http://localhost:7001/metrics","http://localhost:8001/metrics"]
  # These tags are used in the VMware Aria-GemFire integration. Set them to uniquely identify your GemFire cluster.
  [inputs.prometheus.tags]
    "label.gemfire-environment" = "milky-way"
    "label.gemfire-cluster" = "my-cluster"
[[outputs.wavefront]]
    host = "localhost"
    port = 2878
    metric_separator = "."
    source_override = ["hostname", "agent_host", "node_host"]
    convert_paths = true
    use_regex = false
Restart telegraf to use the new configuration:
Mac:
brew services restart telegraf
Windows:
net stop telegraf
net start telegraf
Linux:
sudo service telegraf restart
In a browser, navigate to your GemFire dashboard on VMware Aria. You should see live metrics. To find your VMware Aria dashboard, see VMware Tanzu Observability.
As an alternative, you can view the logfile in a shell window:
tail -f /usr/local/var/log/wavefront/wavefront.log
Output should resemble:
2021-06-02 11:59:20,210 INFO  [proxy:checkin] Checking in: https://vmware.wavefront.com/api
2021-06-02 11:59:20,210 INFO  [proxy:checkin] Checking in: https://vmware.wavefront.com/api
2021-06-02 11:59:29,915 INFO  [AbstractReportableEntityHandler:printStats] [2878] Points received rate: 302 pps (1 min), 296 pps (5 min), 1588 pps (current).
2021-06-02 11:59:29,915 INFO  [AbstractReportableEntityHandler:printStats] [2878] Points received rate: 302 pps (1 min), 296 pps (5 min), 1588 pps (current).
2021-06-02 11:59:29,915 INFO  [AbstractReportableEntityHandler:printStats] [2878] Points delivered rate: 295 pps (1 min), 294 pps (5 min)
2021-06-02 11:59:29,915 INFO  [AbstractReportableEntityHandler:printStats] [2878] Points delivered rate: 295 pps (1 min), 294 pps (5 min)
Verification and Troubleshooting suggestions
If everything is working properly, your cluster should be listed within the Tanzu GemFire integration in VMware Aria.
If everything is not working properly, try these suggestions:
-
GemFire
- Verify the metrics endpoint is hosting metrics by curling one of the metrics endpoints or viewing it in your browser, e.g.
curl localhost:7001/metrics. - View the member’s log and verify the metrics module is loaded.
- Verify the metrics endpoint is hosting metrics by curling one of the metrics endpoints or viewing it in your browser, e.g.
-
Telegraf
- Try viewing its logs or starting it in console mode (for example,
.\telegraf --console installin Windows) to catch any suppressed errors. - Ensure the scraped urls contain the correct metrics ports.
- Try viewing its logs or starting it in console mode (for example,
-
VMware Aria Proxy
- Verify that the VMware Aria Proxy logs are actively receiving datapoints.
- Check that VMware Aria Proxy has the correct subdomain (
<your-subdomain>.wavefront.com) and a valid API key.
Default Dashboard Metrics
These tables list the metrics available in the default VMware Aria dashboard.
Tanzu GemFire Cluster Metrics
| Metric | Description |
|---|---|
| Uptime | Maximum uptime of all members in this cluster |
| Server Count | Count of members that are servers and serve up data in this cluster |
| Locator Count | Count of locators in this cluster. The locator is a Tanzu GemFire process that tells new, connecting members where running members are located and provides load balancing for server use. |
| Region Count | Count of regions in this Tanzu GemFire cluster. Regions hold entries (key/value pairs) in buckets. |
| CPU Count | The current count of CPUs recognized by Tanzu GemFire |
| Cluster Entries | This metric represents the last value registered for the total entry count across all regions and data in the specified Tanzu GemFire cluster. For partitioned data, we take a raw sum of the region entries. For replicate data, we only count the primary copy and only use the result from one server. |
| Server Old Gen Utilization | For each server in this cluster, this chart shows the amount of memory, in bytes, being used by each server and the overall % of that member’s available memory usage on the right axis. |
| Disk Utilization | Disk utilization by member in the cluster. The percentage remaining is computed by using the statistics gathered by Tanzu GemFire from the underlying system. Some operating systems (like macOS) do not emit these metrics and will cause this graph to be empty. |
| CPU Utilization % by Member | The current utilization percentage of this cluster’s CPUs |
| Current Client Connects by Member | This chart displays a line for each server in the cluster and represents the number of external clients connected to that member. |
| Sampler Delay Duration | Delay duration measures the actual time (in ms) the Tanzu GemFire statistics sampler slept. It calculates the difference between when it went to sleep and when it woke up to sample. Sample time shows how long it took to collect the sample after it woke up. |
| Cluster Communication Delays | Tanzu GemFire uses ‘replyWaitsInProgress’ as a means to measure intra-cluster communication and determine a stalled or failing member. |
| IO Waits | The time spent waiting to read or write |
| Abandoned Reads/Second | Tanzu GemFire monitors the AbandonedReadRequests from the cache server. |
| CPU Steal Time | Steal time is the percentage of time a virtual CPU waits for a real CPU while the hypervisor is servicing another virtual processor. Your virtual machine (VM) shares resources with other instances on a single host in a virtualized environment. One of the resources it shares is CPU Cycles. |
Tanzu GemFire Features Metrics
| Metric | Description |
|---|---|
| Gets Throughput | This chart displays the throughput of all ‘Get’ operations performed across the entire cache. RIGHT Axis (RED): The ‘Get’ operation requests by the remote Client applications. LEFT Axis (BLUE): The ‘Get’ operation requests by the remote Client applications and distributed get operations. |
| Average Get Latency | Average Get Latency presents the total time taken by all ‘Get’ operations performed across the cluster divided by the number of all ‘Get’ operations performed across the cluster to get an average time taken per ‘Get’ operation in the system. |
| Cache Hits Per Second | The rate of Get operations across the entire cluster that resulted in a matched key per second. |
| Cache Misses Per Second | This chart represents the rate of Get operations that resulted in a miss, where the key that was requested was not in the cache per second. |
| Puts Throughput | This chart displays the throughput of all ‘Put’ operations performed across the entire cache. RIGHT Axis (RED): The ‘Put’ operation requests by the remote Client applications. LEFT Axis (BLUE): The ‘Put’ operation requests by the remote Client applications and distributed ‘Put’ operations |
| Average Put Latency | Average Put Latency presents the total time taken by all ‘Put’ operations performed across the cluster divided by the number of all ‘Put’ operations performed across the cluster to get an average time taken per ‘Put’ operation in the system. |
| Cache Hit Ratio | The Cache hit ratio is currently based on system ‘Get’ operations and any ‘Get’ operation across the cluster. It represents the percentage of those ‘Get’ operations that return a value based on the specified key. |
| Function Execution Details | RED (RIGHT AXIS): Function Execution Queue size. BLUE (LEFT AXIS): A calculated rate based on functionExecutionCalls minus functionExecutionsCompleted, which provides the output of FAILED function execution calls per second. |
| Client Put Request By Server | For each server member, this chart represents the rate of requests of ‘Put’ operations received per second on a specific member. |
| Persistent Region Overcapacity | For persistent regions that hold data in memory and on disk, we provide this chart to show whether the capacity of system is sufficient to accommodate the stored data. |
| Message Queue Size | Size of the Tanzu GemFire message queue in number of operations (such as ‘Get’, ‘Put’, and ‘Destroy’) that it contains |
| Client Query Rate | The number of queries received per second from GemFire clients |
| Average Query Time | The average query time is computed by taking the total time of all query requests (processQueryTime) and dividing it by the number of requests (queryRequests), to get an average time spent per query. |
| Region Details | This table shows the type, name, and entry count for each region in the cache. For convenience, we have summarized the Partitioned regions with the Partition Total rows. |
WAN Gateway Metrics
| Metric | Description |
|---|---|
| WAN Receiver Throughput | This chart shows all of the Gateway Receivers for this cluster and the rate of bytes/second that are sent (red) or received (blue). |
| WAN Sender Queue | This graph displays the rate (messages/second) at which a Gateway Sender is able to send events to a WAN connected cluster. |
