


Tanzu Observability (formerly VMware Aria Operations for Applications)
This topic discusses how to configure Tanzu Observability (formerly VMware Aria Operations for Applications) with VMware Tanzu GemFire and provides an example.
Tanzu GemFire’s Prometheus Metrics Endpoint provides built-in integration with Tanzu Observability. Prometheus adds a metrics endpoint to a specified Tanzu GemFire member.
By default, this endpoint hosts approximately 200 Tanzu GemFireGemFire metrics at an update interval of one minute. These metrics can be scraped by a metrics collection agent (such as Telegraf) and forwarded to a metrics monitoring platform (such as Aria) for further analysis and alerting.
Delivering Tanzu GemFire Metrics through Telegraf and VMware Aria Proxy to Tanzu Observability 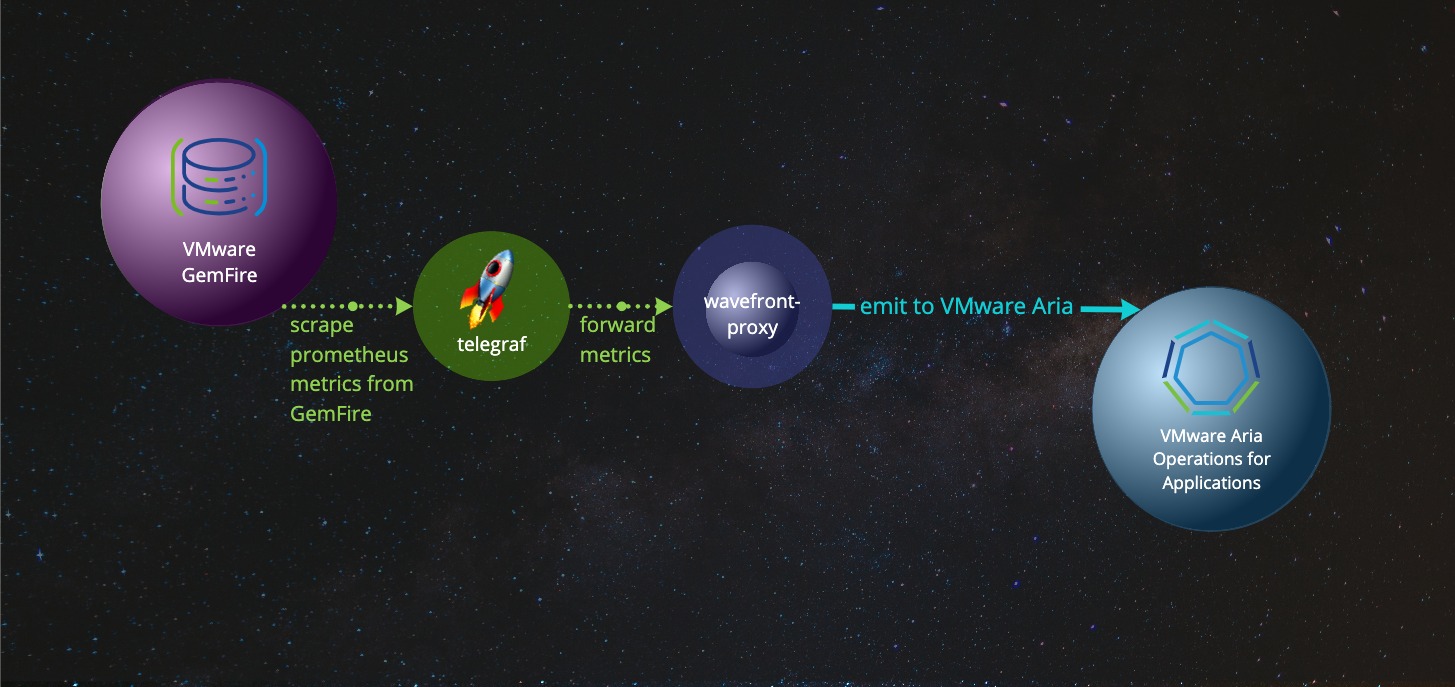
To enable VMware Aria-viewable metrics across your Tanzu GemFire cluster see the Prometheus Metrics Endpoint documentation for starting and configuring the Tanzu GemFire cluster.
After the Tanzu GemFire cluster is configured you must configure Telegraf and the Aria Proxy.
Telegraf and VMware Aria Proxy Setup Example
This example uses Telegraf as the agent to pull VMware Aria-viewable Prometheus-style metrics from a Tanzu GemFire cluster. Telegraf sends the metrics to a local VMware Aria proxy, which forwards them to the VMware Aria service.
Install Telegraf and VMware Aria Proxy
-
Install Telegraf and the VMware Aria Proxy for your operating system, using the instructions found in the VMware Aria product documentation:
-
Acquire an API token that authenticates communication from the VMware Aria Proxy by follow the instruction in Generating an API Token in the VMware Aria product documentation.
Configure Telegraf
-
After installation, add the following
inputs.prometheussection to your to your Telegraf configuration file with your selected tags and the URL to your metrics endpoints. Your Telegraf configuration file should contain the specified tags and URLs to instruct Telegraf to scrape metrics from GemFire’s Prometheus metrics endpoints.Example configuration file named “tanzu-gemfire.conf”:
# Telegraf config to scrape GemFire metrics [agent] interval = "10s" [[inputs.prometheus]] urls = ["http://localhost:7001/metrics","http://localhost:8001/metrics"] # These tags are used in the VMware Aria-GemFire integration. Set them to uniquely identify your GemFire cluster. [inputs.prometheus.tags] "label.gemfire-environment" = "milky-way" "label.gemfire-cluster" = "my-cluster" [[outputs.wavefront]] host = "localhost" port = 2878 metric_separator = "." source_override = ["hostname", "agent_host", "node_host"] convert_paths = true use_regex = false -
Restart telegraf to use the new configuration:
Linux:
sudo service telegraf restartMacOS:
brew services restart telegrafWindows:
net stop telegraf net start telegraf -
In a browser, navigate to your GemFire dashboard on VMware Aria. You should see live metrics. To find your VMware Aria dashboard, see instructions in Tanzu Observability.
-
You can also view the logfile in a shell window:
tail -f /usr/local/var/log/wavefront/wavefront.logThe output should resemble the following:
2021-06-02 11:59:20,210 INFO  [proxy:checkin] Checking in: https://vmware.wavefront.com/api
2021-06-02 11:59:20,210 INFO  [proxy:checkin] Checking in: https://vmware.wavefront.com/api
2021-06-02 11:59:29,915 INFO  [AbstractReportableEntityHandler:printStats] [2878] Points received rate: 302 pps (1 min), 296 pps (5 min), 1588 pps (current).
2021-06-02 11:59:29,915 INFO  [AbstractReportableEntityHandler:printStats] [2878] Points received rate: 302 pps (1 min), 296 pps (5 min), 1588 pps (current).
2021-06-02 11:59:29,915 INFO  [AbstractReportableEntityHandler:printStats] [2878] Points delivered rate: 295 pps (1 min), 294 pps (5 min)
2021-06-02 11:59:29,915 INFO  [AbstractReportableEntityHandler:printStats] [2878] Points delivered rate: 295 pps (1 min), 294 pps (5 min)
Verification and Troubleshooting
If everything is working properly, your cluster should be listed within the Tanzu GemFire integration in VMware Aria.
If everything is not working properly:
-
GemFire
- Verify that the metrics endpoint is hosting metrics by curling one of the metrics endpoints or viewing it in your browser. For example:
curl localhost:7001/metrics - View the member’s log and verify that the metrics module is loaded.
- Verify that the metrics endpoint is hosting metrics by curling one of the metrics endpoints or viewing it in your browser. For example:
-
Telegraf
- View the Telegraf logs or start Telegraf in console mode to catch any suppressed errors.
- Ensure that the scraped URLs contain the correct metrics ports.
-
VMware Aria Proxy
- Verify that the VMware Aria Proxy logs are actively receiving datapoints.
- Verify that the VMware Aria Proxy has the correct subdomain,
<your-subdomain>.wavefront.com, and a valid API key.
Default Dashboard Metrics
These tables list the metrics available in the default VMware Aria dashboard.
Tanzu GemFire Cluster Metrics
| Metric | Description |
|---|---|
| Uptime | Maximum uptime of all members in this cluster |
| Server Count | Count of members that are servers and serve up data in this cluster |
| Locator Count | Count of locators in this cluster. The locator is a Tanzu GemFire process that tells new, connecting members where running members are located and provides load balancing for server use. |
| Region Count | Count of regions in this Tanzu GemFire cluster. Regions hold entries (key/value pairs) in buckets. |
| CPU Count | The current count of CPUs recognized by Tanzu GemFire |
| Cluster Entries | This metric represents the last value registered for the total entry count across all regions and data in the specified Tanzu GemFire cluster. For partitioned data, we take a raw sum of the region entries. For replicate data, we only count the primary copy and only use the result from one server. |
| Server Old Gen Utilization | For each server in this cluster, this chart shows the amount of memory, in bytes, being used by each server and the overall percentage of that member’s available memory usage on the right axis. |
| Disk Utilization | Disk utilization by member in the cluster. The percentage remaining is computed by using the statistics gathered by Tanzu GemFire from the underlying system. Some operating systems (like macOS) do not emit these metrics and will cause this graph to be empty. |
| CPU Utilization % by Member | The current utilization percentage of this cluster’s CPUs |
| Current Client Connects by Member | This chart displays a line for each server in the cluster and represents the number of external clients connected to that member. |
| Sampler Delay Duration | Delay duration measures the actual time (in ms) the Tanzu GemFire statistics sampler slept. It calculates the difference between when it went to sleep and when it woke up to sample. Sample time shows how long it took to collect the sample after it woke up. |
| Cluster Communication Delays | Tanzu GemFire uses replyWaitsInProgress as a means to measure intra-cluster communication and determine a stalled or failing member. |
| IO Waits | The time spent waiting to read or write |
| Abandoned Reads/Second | Tanzu GemFire monitors the AbandonedReadRequests from the cache server. |
| CPU Steal Time | Steal time is the percentage of time a virtual CPU waits for a real CPU while the hypervisor is servicing another virtual processor. Your virtual machine shares resources with other instances on a single host in a virtualized environment. One of the resources it shares is CPU Cycles. |
Tanzu GemFire Features Metrics
| Metric | Description |
|---|---|
| Gets Throughput | This chart displays the throughput of all Get operations performed across the entire cache.RIGHT Axis (RED): The Get operation requests by the remote Client applications.LEFT Axis (BLUE): The Get operation requests by the remote Client applications and distributed get operations. |
| Average Get Latency | Average Get Latency presents the total time taken by all Get operations performed across the cluster divided by the number of all Get operations performed across the cluster to get an average time taken per Get operation in the system. |
| Cache Hits Per Second | The rate of Get operations across the entire cluster that resulted in a matched key per second. |
| Cache Misses Per Second | This chart represents the rate of Get operations that resulted in a miss, where the key that was requested was not in the cache per second. |
| Puts Throughput | This chart displays the throughput of all Put operations performed across the entire cache.RIGHT Axis (RED): The Put operation requests by the remote Client applications.LEFT Axis (BLUE): The Put operation requests by the remote Client applications and distributed Put operations |
| Average Put Latency | Average Put Latency presents the total time taken by all Put operations performed across the cluster divided by the number of all Put operations performed across the cluster to get an average time taken per Put operation in the system. |
| Cache Hit Ratio | The Cache hit ratio is currently based on system Get operations and any Get operation across the cluster. It represents the percentage of those Get operations that return a value based on the specified key. |
| Function Execution Details | RED (RIGHT AXIS): Function Execution Queue size. BLUE (LEFT AXIS): A calculated rate based on functionExecutionCalls minus functionExecutionsCompleted, which provides the output of FAILED function execution calls per second. |
| Client Put Request By Server | For each server member, this chart represents the rate of requests of Put operations received per second on a specific member. |
| Persistent Region Overcapacity | For persistent regions that hold data in memory and on disk, we provide this chart to show whether the capacity of system is sufficient to accommodate the stored data. |
| Message Queue Size | Size of the Tanzu GemFire message queue in number of operations (such as Get, Put, and Destroy) that it contains |
| Client Query Rate | The number of queries received per second from GemFire clients |
| Average Query Time | The average query time is computed by taking the total time of all query requests (processQueryTime) and dividing it by the number of requests (queryRequests), to get an average time spent per query. |
| Region Details | This table shows the type, name, and entry count for each region in the cache. For convenience, we have summarized the Partitioned regions with the Partition Total rows. |
WAN Gateway Metrics
| Metric | Description |
|---|---|
| WAN Receiver Throughput | This chart shows all of the Gateway Receivers for this cluster and the rate of bytes/second that are sent (red) or received (blue). |
| WAN Sender Queue | This graph displays the rate (messages/second) at which a Gateway Sender is able to send events to a WAN connected cluster. |
