


This topic explains VMware Tanzu GemFire architecture and components.
Tanzu GemFire’s management and monitoring system consists of a single JMX Manager node and one or more managed nodes within a cluster. All members in the cluster are manageable through MBeans and Tanzu GemFire Management Service APIs.
Architecture
The following diagram depicts the architecture of the management and monitoring system components.
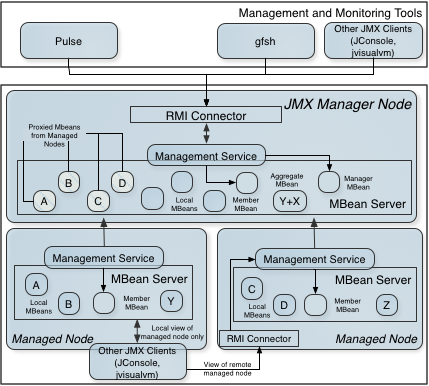
In this architecture every Tanzu GemFire member is manageable. All Tanzu GemFire MBeans for the local Tanzu GemFire processes are automatically registered in the Platform MBeanServer (the default MBeanServer of each JVM that hosts platform MXBeans.)
Managed Node
Each member of a cluster is a managed node. Any node that is not currently also acting as a JMX Manager node is referred to simply as a managed node. A managed node has the following resources so that it can answer JMX queries both locally and remotely:
- Local MXBeans that represent the locally monitored components on the node. See List of Tanzu GemFire JMX MBeans for a list of possible MXBeans existing for the managed node.
- Built-in platform MBeans.
JMX Manager Node
A JMX Manager node is a member that can manage other Tanzu GemFire members—that is, other managed nodes—as well as itself. A JMX Manager node can manage all other members in the cluster.
To convert a managed node to a JMX Manager node, you configure the Tanzu GemFire property jmx-manager=true, in the gemfire.properties file, and start the member as a JMX Manager node.
You start the member as a JMX Manager node when you provide --J=-Dgemfire.jmx-manager=true as an argument to either the start server or start locator command. See Starting a JMX Manager for more information.
The JMX Manager node has the following extra resources allocated so that it can answer JMX queries:
- RMI connector that allows JMX clients to connect to and access all MXBeans in the cluster.
- Local MXBeans that represent the locally monitored components on this node, same as any other managed node.
- Aggregate MXBeans:
- DistributedSystemMXBean
- DistributedRegionMXBean
- DistributedLockServiceMXBean
- ManagerMXBean with Scope=ALL, which allows various cluster-wide operations.
- Proxy to MXBeans on managed nodes.
- Built-in platform MXBeans.
JMX Integration
Management and monitoring tools such as gfsh command-line interface and Pulse use JMX/RMI as the communication layer to connect to Tanzu GemFire nodes. All Tanzu GemFire processes by default allow JMX connections to the Platform MBeanServer from localhost. By default, both managed nodes and JMX manager nodes have RMI connectors enabled to allow JMX client connections.
Note: GemFire 10.1 deprecates Pulse in favor of VMware GemFire Management Console. Pulse will be removed in a future release.
JConsole (and other similar JMX clients that support Sun’s Attach API) can connect to any local JVM without requiring an RMI connector by using the Attach API. This allows connections from the same machine.
JConsole (and other JMX clients) can connect to any JVM if that JVM is configured to start an RMI connector. This allows remote connections from other machines.
JConsole can connect to any Tanzu GemFire member, but if it connects to a non-JMX-Manager member, JConsole only detects the local MBeans for the node, and not MBeans for the cluster.
When a Tanzu GemFire locator or server becomes a JMX Manager for the cluster, it enables the RMI connector. JConsole can then connect only to that one JVM to view the MBeans for the entire cluster. It does not need to connect to all the other JVMs. Tanzu GemFire manages the inter-JVM communication required to provide a federated view of all MBeans in the cluster.
gfsh can only connect to a JMX Manager or to a locator. If connected to a locator, the locator provides the necessary connection information for the existing JMX Manager. If the locator detects a JMX Manager is not already running in the cluster, the locator makes itself a JMX Manager. gfsh cannot connect to other non-Manager or non-locator members.
For information about how to configure the RMI registry and RMI connector, see Configuring RMI Registry Ports and RMI Connectors.
Management APIs
Tanzu GemFire management APIs represent the Tanzu GemFire cluster to a JMX user. However, they do not provide functionality that is otherwise present in JMX. They only provide a gateway into various services exclusively offered by Tanzu GemFire monitoring and management.
The entry point to Tanzu GemFire management is through the ManagementService interface. For example, to create an instance of the Management Service:
ManagementService service = ManagementService.getManagementService(cache);
The resulting ManagementService instance is specific to the provided cache and its cluster. The implementation of getManagementService is a singleton for now but may eventually support multiple cache instances.
You can use the Tanzu GemFire management APIs to accomplish the following tasks:
- Monitor the health status of clients.
- Obtain the status and results of individual disk backups.
- View metrics related to disk usage and performance for a particular member.
- Browse Tanzu GemFire properties set for a particular member.
- View JVM metrics such as memory, heap, and thread usage.
- View network metrics, such as bytes received and sent.
- View partition region attributes such as total number of buckets, redundant copy, and maximum memory information.
- View persistent member information such as disk store ID.
- Browse region attributes.
See the JavaDocs for the org.apache.geode.management package for more details.
You can also execute gfsh commands using the ManagementService API. See Executing gfsh Commands through the Management API and the JavaDocs for the org.apache.geode.management.cli package.
Tanzu GemFire Management and Monitoring Tools
This section lists the currently available tools for managing and monitoring Tanzu GemFire:
- gfsh: VMware Tanzu GemFire command-line interface that provides a simple and powerful command shell that supports the administration, debugging and deployment of Tanzu GemFire applications. It features context sensitive help, scripting and the ability to invoke any commands from within the application using a simple API. See gfsh.
- Tanzu GemFire Pulse: Easy-to-use, browser-based dashboard for monitoring Tanzu GemFire deployments. Tanzu GemFire Pulse provides an integrated view of all Tanzu GemFire members within a cluster. See Tanzu GemFire Pulse.
- Pulse Data Browser: This Tanzu GemFire Pulse utility provides a graphical interface for performing OQL ad-hoc queries in a Tanzu GemFire cluster. See Data Browser.
- JConsole: A JMX-based management and monitoring tool provided in the Java 2 Platform that provides information about the performance and consumption of resources by Java applications. See Using JConsole in the Java SE documentation on the Oracle website.
- Java VisualVM (jvisualvm): A profiling tool for analyzing your Java Virtual Machine. Java VisualVM is useful to Java application developers to troubleshoot applications and to monitor and improve the applications’ performance. Java VisualVM can allow developers to generate and analyse heap dumps, track down memory leaks, perform and monitor garbage collection, and perform lightweight memory and CPU profiling. For more details about using jvisualvm, see jvisualvm in the Java SE documentation on the Oracle website.
