Using the Tanzu GemFire Resource Manager
The Tanzu GemFire resource manager works with your JVM’s tenured garbage collector to control heap use and protect your member from hangs and crashes due to memory overload.
The Tanzu GemFire resource manager prevents the cache from consuming too much memory by evicting old data. If the garbage collector is unable to keep up, the resource manager refuses additions to the cache until the collector has freed an adequate amount of memory.
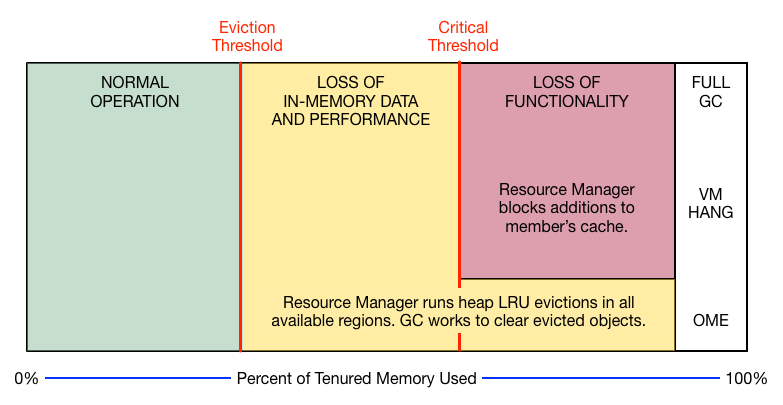
The resource manager has two threshold settings, each expressed as a percentage of the total tenured heap. Both are deactivated by default.
-
Eviction Threshold. Above this, the manager orders evictions for all regions with
eviction-attributesset tolru-heap-percentage. This prompts dedicated background evictions, independent of any application threads and it also tells all application threads adding data to the regions to evict at least as much data as they add. The JVM garbage collector removes the evicted data, reducing heap use. The evictions continue until the manager determines that heap use is again below the eviction threshold.The resource manager enforces eviction thresholds only on regions whose LRU eviction policies are based on heap percentage. Regions whose eviction policies based on entry count or memory size use other mechanisms to manage evictions. See Eviction for more detail regarding eviction policies.
-
Critical Threshold. Above this, all activity that might add data to the cache is refused. This threshold is set above the eviction threshold and is intended to allow the eviction and GC work to catch up. This JVM, all other JVMs in the distributed system, and all clients to the system receive
LowMemoryExceptionfor operations that would add to this critical member’s heap consumption. Activities that fetch or reduce data are allowed. For a list of refused operations, see the Javadocs for theResourceManagermethodsetCriticalHeapPercentage.Critical threshold is enforced on all regions, regardless of LRU eviction policy, though it can be set to zero to deactivate its effect.

When heap use passes the eviction threshold in either direction, the manager logs an info-level message.
When heap use exceeds the critical threshold, the manager logs an error-level message. Avoid exceeding the critical threshold. Once identified as critical, the Tanzu GemFire member becomes a read-only member that refuses cache updates for all of its regions, including incoming distributed updates.
For more information, see org.apache.geode.cache.control.ResourceManager in the online API documentation.
How Background Eviction Is Performed
When the manager kicks off evictions:
- From all regions in the local cache that are configured for heap LRU eviction, the background eviction manager creates a randomized list containing one entry for each partitioned region bucket (primary or secondary) and one entry for each non-partitioned region. So each partitioned region bucket is treated the same as a single, non-partitioned region.
- The background eviction manager starts four evictor threads for each processor on the local machine. The manager passes each thread its share of the bucket/region list. The manager divides the bucket/region list as evenly as possible by count, and not by memory consumption.
- Each thread iterates round-robin over its bucket/region list, evicting one LRU entry per bucket/region until the resource manager sends a signal to stop evicting.
See also Memory Requirements for Cached Data.
Controlling Heap Use with the Resource Manager
Resource manager behavior is closely tied to the triggering of Garbage Collection (GC) activities, the use of concurrent garbage collectors in the JVM, and the number of parallel GC threads used for concurrency.
The recommendations provided here for using the manager assume you have a solid understanding of your Java VM’s heap management and garbage collection service.
The resource manager is available for use in any Tanzu GemFire member, but you may not want to activate it everywhere. For some members it might be better to occasionally restart after a hang or OME crash than to evict data and/or refuse distributed caching activities. Also, members that do not risk running past their memory limits would not benefit from the overhead the resource manager consumes. Cache servers are often configured to use the manager because they generally host more data and have more data activity than other members, requiring greater responsiveness in data cleanup and collection.
For the members where you want to activate the resource manager:
- Configure Tanzu GemFire for heap LRU management.
- Set the JVM GC tuning parameters to handle heap and garbage collection in conjunction with the Tanzu GemFire manager.
- Monitor and tune heap LRU configurations and your GC configurations.
- Before going into production, run your system tests with application behavior and data loads that approximate your target systems so you can tune as well as possible for production needs.
- In production, keep monitoring and tuning to meet changing needs.
Configure Tanzu GemFire for Heap LRU Management
The configuration terms used here are cache.xml elements and attributes, but you can also configure through gfsh and the org.apache.geode.cache.control.ResourceManager and Region APIs.
- When starting up your server, set
initial-heapandmax-heapto the same value. -
Set the
resource-managercritical-heap-percentagethreshold. This should be as as close to 100 as possible while still low enough so the manager’s response can prevent the member from hanging or gettingOutOfMemoryError. The threshold is zero (no threshold) by default. Note: When you set this threshold, it also enables a query monitoring feature that prevents most out-of-memory exceptions when executing queries or creating indexes. See Monitoring Queries for Low Memory. -
Set the
resource-managereviction-heap-percentagethreshold to a value lower than the critical threshold. This should be as high as possible while still low enough to prevent your member from reaching the critical threshold. The threshold is zero (no threshold) by default. - Decide which regions will participate in heap eviction and set their
eviction-attributestolru-heap-percentage. See Eviction. The regions you configure for eviction should have enough data activity for the evictions to be useful and should contain data your application can afford to delete or offload to disk.
gfsh example:
gfsh>start server --name=server1 --initial-heap=30m --max-heap=30m \
--critical-heap-percentage=80 --eviction-heap-percentage=60
cache.xml example:
<cache>
<region refid="REPLICATE_HEAP_LRU" />
...
<resource-manager critical-heap-percentage="80" eviction-heap-percentage="60"/>
</cache>
Note: The resource-manager specification must appear after the region declarations in your cache.xml file.
Tuning the JVM’s Garbage Collection Parameters
Because VMware Tanzu GemFire is specifically designed to manipulate data held in memory, you can optimize your application’s performance by tuning the way VMware Tanzu GemFire uses the JVM heap.
See your JVM documentation for all JVM-specific settings that can be used to improve garbage collection (GC) response. Best configuration can vary depending of the use case and JVM garbage collector used.
Concurrent Mark-Sweep (CMS) Garbage Collector
If you are using concurrent mark-sweep (CMS) garbage collection with VMware Tanzu GemFire, use the following settings to improve performance:
- Set the initial and maximum heap switches,
-Xmsand-Xmx, to the same values. Thegfsh start serveroptions--initial-heapand--max-heapaccomplish the same purpose, with the added value of providing resource manager defaults such as eviction threshold and critical threshold. - If your JVM allows, configure it to initiate CMS collection when heap use is at least 10% lower than your setting for the resource manager
eviction-heap-percentage. You want the collector to be working when Tanzu GemFire is evicting or the evictions will not result in more free memory. For example, if theeviction-heap-percentageis set to 65, set your garbage collection to start when the heap use is no higher than 55%.
| JVM | CMS switch flag | CMS initiation (begin at heap % N) |
|---|---|---|
| Sun HotSpot | ‑XX:+UseConcMarkSweepGC |
‑XX:CMSInitiatingOccupancyFraction=N |
| JRockit | -Xgc:gencon |
-XXgcTrigger:N |
| IBM | -Xgcpolicy:gencon |
N/A |
For the gfsh start server command, pass these settings with the --J switch, for example: ‑‑J=‑XX:+UseConcMarkSweepGC.
The following is an example of setting Hotspot JVM for an application:
$ java app.MyApplication -Xms=30m -Xmx=30m -XX:+UseConcMarkSweepGC -XX:CMSInitiatingOccupancyFraction=60
Note: Do not use the -XX:+UseCompressedStrings and -XX:+UseStringCache JVM configuration properties when starting up servers. These JVM options can cause issues with data corruption and compatibility.
Or, using gfsh:
$ gfsh start server --name=app.MyApplication --initial-heap=30m --max-heap=30m \
--J=-XX:+UseConcMarkSweepGC --J=-XX:CMSInitiatingOccupancyFraction=60
Garbage First (G1) Garbage Collector
Although the garbage first (G1) garbage collector works effectively with VMware Tanzu GemFire, issues can arise in some cases due to the differences between CMS and G1. For example, G1 by design is not able to set a maximum tenured heap size, so when this value is requested from the garbage collector, it reports the total heap maximum size. This impacts VMware Tanzu GemFire, as the resource manager uses the maximum size of the tenured heap size to calculate the value in bytes of the eviction and critical percentages. Extensive testing is recommended before using G1 garbage collector. See your JVM documentation for all JVM-specific settings that can be used to improve garbage collection (GC) response.
Size of objects stored on a region must also be taken into account. If the primary heap objects you allocate are larger than 50 percent of the G1 region size (what are called “humongous” objects), this can cause the JVM to report out of heap memory when it has used only 50 percent of the heap. The default G1 region size is 1 Mb; it can be increased up to 32 Mb (with values that are always a power of 2) by using the --J-XX:G1HeapRegionSize=VALUE JVM parameter. If you are using large objects and want to use G1GC without increasing its heap region size (or if your values are larger than 16 Mb), then you could configure your VMware Tanzu GemFire regions to store the large values off-heap. However, even if you do that the large off-heap values will allocate large temporary heap values that G1GC will treat as “humongous” allocations, even though they will be short lived. Consider using CMS if most of you values will result in “humongous” allocations.
Z Garbage Collector (ZGC)
If you are using the Z garbage collector (ZGC) with VMware Tanzu GemFire, use the following settings to improve performance:
-
Set the initial and maximum heap switches,
-Xmsand-Xmx, to the same values. Alternatively, use the gfshstart serveroptions--initial-heap and --max-heapto set these values. -
Configure ZGC to initiate collection when heap use is at least 5% lower than your setting for the resource manager eviction-heap-percentage. You want the collector to be working when Tanzu GemFire is evicting or the evictions will not result in more free memory. For example, if the
--eviction-heap-percentageis set to65, set-XX:SoftMaxHeapSizeto a value no higher than 60% of maximum heap size.
Monitor and Tune Heap LRU Configurations
In tuning the resource manager, your central focus should be keeping the member below the critical threshold. The critical threshold is provided to avoid member hangs and crashes, but because of its exception-throwing behavior for distributed updates, the time spent in critical negatively impacts the entire distributed system. To stay below critical, tune so that the Tanzu GemFire eviction and the JVM’s GC respond adequately when the eviction threshold is reached.
Use the statistics provided by your JVM to make sure your memory and GC settings are sufficient for your needs.
The Tanzu GemFire ResourceManagerStats provide information about memory use and the manager thresholds and eviction activities.
If your application spikes above the critical threshold on a regular basis, try lowering the eviction threshold. If the application never goes near critical, you might raise the eviction threshold to gain more usable memory without the overhead of unneeded evictions or GC cycles.
The settings that will work well for your system depend on a number of factors, including these:
-
The size of the data objects you store in the cache: Very large data objects can be evicted and garbage collected relatively quickly. The same amount of space in use by many small objects takes more processing effort to clear and might require lower thresholds to allow eviction and GC activities to keep up.
-
Application behavior: Applications that quickly put a lot of data into the cache can more easily overrun the eviction and GC capabilities. Applications that operate more slowly may be more easily offset by eviction and GC efforts, possibly allowing you to set your thresholds higher than in the more volatile system.
-
Your choice of JVM: Each JVM has its own GC behavior, which affects how efficiently the collector can operate, how quickly it kicks in when needed, and other factors.
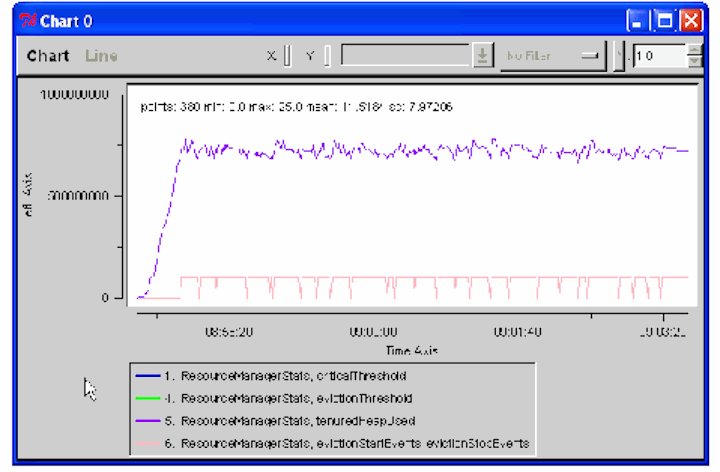
In this sample statistics chart in VSD, the manager’s evictions and the JVM’s GC efforts are good enough to keep heap use very close to the eviction threshold. The eviction threshold could be increased to a setting closer to the critical threshold, allowing the member to keep more data in tenured memory without the risk of overwhelming the JVM. This chart also shows the blocks of times when the manager was running cache evictions.

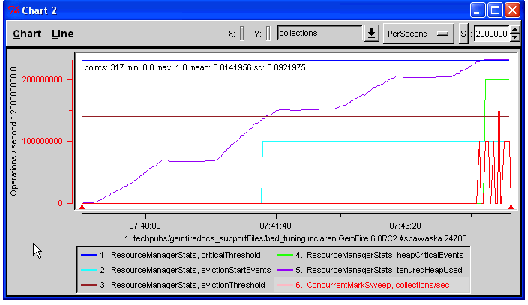
In this next chart, it looks like the manager’s evictions are kicking in at the right time, but the CMS garbage collector is not starting soon enough to keep memory use in check. It might be that it is not configured to start as soon as it should. It should be started just before the eviction threshold is reached. Or there might be some other issue with the garbage collection service.

Resource Manager Example Configurations
These examples set the critical threshold to 85 percent of the tenured heap and the eviction threshold to 75 percent. The region bigDataStore is configured to participate in the resource manager’s eviction activities.
-
gfsh Example:
gfsh>start server --name=server1 --initial-heap=30m --max-heap=30m \
--critical-heap-percentage=85 --eviction-heap-percentage=75
gfsh>create region --name=bigDataStore --type=PARTITION_HEAP_LRU -
XML:
<cache>
<region name="bigDataStore" refid="PARTITION_HEAP_LRU"/>
...
<resource-manager critical-heap-percentage="85" eviction-heap-percentage="75"/>
</cache>
Note: The
resource-managerspecification must appear after the region declarations in your cache.xml file. -
Java:
Cache cache = CacheFactory.create();

ResourceManager rm = cache.getResourceManager();
rm.setCriticalHeapPercentage(85);
rm.setEvictionHeapPercentage(75);

RegionFactory rf =
  cache.createRegionFactory(RegionShortcut.PARTITION_HEAP_LRU);
  Region region = rf.create("bigDataStore");
Use Case for the Example Code
This is one possible scenario for the configuration used in the examples:
- A 64-bit Java VM with 8 Gb of heap space on a 4 CPU system running Linux.
- The data region bigDataStore has approximately 2-3 million small values with average entry size of 512 bytes. So approximately 4-6 Gb of the heap is for region storage.
- The member hosting the region also runs an application that may take up to 1 Gb of the heap.
- The application must never run out of heap space and has been crafted such that data loss in the region is acceptable if the heap space becomes limited due to application issues, so the default
lru-heap-percentageaction destroy is suitable. - The application’s service guarantee makes it very intolerant of
OutOfMemoryExceptionerrors. Testing has shown that leaving 15% head room above the critical threshold when adding data to the region gives 99.5% uptime with noOutOfMemoryExceptionerrors, when configured with the CMS garbage collector using-XX:CMSInitiatingOccupancyFraction=70.