


A large number of statistics are intended only for product support and engineering. This topic describes the most important categories and the useful statistics they contain.
For a reference on Tanzu GemFire statistics, see Statistics List.
Runtime Configuration
As the name implies, these statistics can help with verifying the runtime configuration of a GemFire system:
- The number of peer nodes (i.e. servers or peer accessors) in the system: DistributionStats:nodes. This value should be the same for every node in the system.
- The number of clients and client connections for each server: CacheServerStats: currentClients, and currentClientConnections
- The number of data entries:
- CachePerfStats:entries. Each region has its own CachePerfStats instance per JVM named RegionStats-REGION-NAME, or RegionStats-partition-REGION-NAME for partitioned regions. Its entries statistic is the number of entries for that region in the JVM.
- DiskRegionStatistics (a per region disk statistic category about the region’s disk use): entriesInVM, and entriesOnlyOnDisk show the number of entries in the JVM (which can also be on disk too), and the number of entries that are only on disk, respectively.
- Partitioned Region Configuration: One of the main parameters of Partitioned Region (PR) configuration is the primary bucket distribution. To make sure that primary buckets for a PR are evenly distributed, check the PartitionedRegionStats.primaryBucketCount statistic for each partition. This statistic shows the number of primary buckets in a partition.
Resources
The resources that are vital for normal operation and performance are memory, file descriptors (most importantly sockets, then files), CPU, network, and disk (when disk operations, such as overflow and persistence, are involved). The following stats cover all those:
- Memory: There are several stats categories that show memory usage, for different types and granularity of memory.
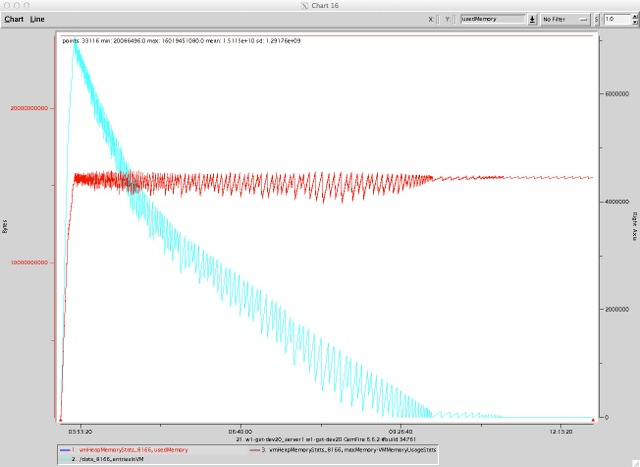
- Heap: VMMemoryUsageStats:vmHeapMemoryStats are all about heap usage, as are the memory stats under VMStats:vmStats: freeMemory, totalMemory, and maxMemory.
- Non-heap memory: VMMemoryUsageStats:vmNonHeapMemoryStats.
- System-wide memory stats as reported by the OS: The OS statistic category (e.g. LinuxSystemStats on Linux) includes various system level memory statistics, such as freeMemory, which shows the free memory on the host (as opposed to related to the JVM process), physicalMemory (total physical memory on the host), paging related statistics (pagesSwappedIn, pagesSwappedOut, unallocatedSwap).
- Client and gateway queue sizes: while not actual resources, these queues may be responsible for increased memory usage, so it’s good to keep them in mind when investigating memory issues. The client queue stats are in ClientSubscriptionStats category: eventsQueued, and eventsRemoved. The difference between the two is the current queue size. The gateway queue stats are in GatewaySenderStatistics category: eventQueueSize is the size of the queue.
- File Descriptors: file descriptor related statistics are captured in the category VMStats: fdsOpen and fdLimit show the number of open file descriptors, and the limit on file descriptors for the host, respectively.
- CPU: The CPU usage is captured in OS statistic category, e.g. LinuxSystemStats. The statistic cpuActive shows the percentage of the total available CPU time that has been used in a non-idle state.
- System load: OS statistic category (e.g. LinuxSystemStats) includes the loadAverage1, loadAverage5, loadAverage15 statistics, which show the average system load for 1, 5, and 15 minutes.
- Network: OS stats also include network related stats for received (recv) and transmitted traffic (recvBytes, xmitBytes, recvErrors, xmitErrors).
- Disk: DiskDirStatistics:diskSpace shows the amount of disk space used for Tanzu GemFire disk storage on a given disk. Above mentioned entriesOnlyOnDisk, and entriesInVM from DiskRegionStatistics are useful for determining the distribution of data between memory and disk, for regions that use disk overflow/persistence.
The following chart is an example of examining the vmHeapMemoryStats in relation to the entriesInVM statistic.
Throughput for Different Operations
There are several stat categories that capture the throughput for Tanzu GemFire operations: CachePerfStats (non-PR, and PR specific), andCacheServerStats, which capture throughput statistics with respect to clients. Note that the PR specific instances of CachePerfStats cover only the specific partitioned regions, while the CachePerfStats instance includes aggregate stats for all non-PR regions.
- CachePerfStats category includes the following stats (all measured in the number of operations per second):
- gets: the number of successful
gets - puts: the number of times an entry has been added or replaced as a result of a local operation (put, create, or get which results in a load, netsearch, or netload of a value)
- updates: the number of updates originating remotely
- putalls: the number of
putAlloperations - destroys: the number of destroys
- Function execution: FunctionService
- Queries: queryExecutions: the number of query executions
- Transactions: txCommits, txFailures, txRollbacks: the number of successful, failed, and rolled back transactions, respectively
- gets: the number of successful
- CacheServerStats category includes the following throughput stats for client operations on the cache server:
- getRequests, getResponses
- getAllRequests, getAllResponses
- putRequests, putResponses
- putAllRequests, putAllResponses
- queryRequests, queryResponses
- Disk operations: If any disk related statistic categories are present in VSD, it means that there is disk activity (some entries are on disk). Presence of disk operations may explain a drop in throughput, as disk use slows things down.
- DiskRegionStatistics (statistics about a region disk use): writes, writeTime, writtenBytes, reads, readTime, readBytes
- DiskStoreStatistics are statistics about a specific disk store’s use of disk. In addition to write/read as those in DiskRegionStatistics, this category includes queueSize statistic, which shows the current number of entries in the asynchronous queue waiting to be flushed to disk.
