The Query Monitor view allows you to view information for all Greenplum Database server queries, including details about queries running, queued to run, and blocked by other queries.
In addition, the Query Monitor displays a variety of information about sessions, such as session status, associated users and databases, idle time, and associated queries.
Users with Admin or Operator privileges can see and cancel all users’ queries, or can move queries. They can also see and cancel all users’ sessions, and export session details to a CSV file.

If a Command Center administrator has enabled Query Monitor Guest Access, anyone able to access the Command Center web server can view the system status and query list on this page without signing in to Command Center. Anonymous users, however, cannot cancel queries or access any other Command Center features.
With the information available in this view, Greenplum Database administrators can easily:
- Understand how the system is being used — both in real-time and trending over time.
- Identify and diagnose problem queries while they are running, detect skew, find runaway queries, and so on.
- Review and balance the query load on the system by better optimizing and scheduling the query load.
- Cancel queries that disrupt system performance.
- Cancel idle sessions.
- View and isolate queries with high CPU consumption.
gpmon user in the gpperfmon database.
Query Metrics
To display query metrics, click the Queries tab. The Query Monitor table displays the following columns for queries.
Query ID
An identification string for the query. If the column is blank, no query ID has been assigned yet. In the Console, this looks like “1295397846-56415-2”. Command Center generates this ID by combining the query record’s tmid, ssid, and ccnt fields.
tmidis a time identifier for the query.ssidis the session id.ccntis the number of the command within the session.
Status
The status of the query. This can be one of the following:
- Queued: the query has not yet started to execute
- Running: execution has started, but is not yet complete
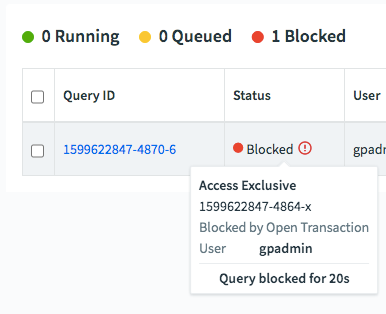
- Blocked: the query is waiting for one or more other queries to release locks
- Done: completed successfully
- Cancelling: cancel request sent, cancel pending
- Cancelled: terminated, no longer running
- Idle Transaction: the transaction is open, but idle, for example, waiting while a user in an interactive session enters a statement
User
The Greenplum Database role that submitted the query.
Database
The name of the database that was queried.
Workload
The resource group or resource queue that is managing the query.
Submitted
The time the query was submitted to the query planner.
Queued Time
The amount of time the query has been (or was) in queue awaiting execution.
Run Time
The amount of time since query execution began.
Spill Files
The total size of spill files created for the query. Greenplum Database creates spill files when there is insufficient memory to to execute the query in memory. See Managing Spill Files Generated by Queries for information about spill files.
CPU Time
Shows the amount of system CPU consumed by the individual query.
Session Information
To display session information, click the Sessions tab. The Query Monitor table displays the following columns for sessions.
Session ID
An identification string for the session.
User
The Greenplum Database role that established the session.
Database
The name of the database connected to in the session.
Status
The status of the session. This can be one of the following:
- active: the connection is working
- idle: the connection is idle
- idle in transaction: a transaction is running but not active, potentially waiting for user input
- idle in transaction (aborted): similar to idle in transaction except that one of the statements in the transaction caused an error
Start Time
The time the session was established.
Application Name
The name of the application that established the connection, for example, psql.
Idle Time
The amount of time since activity was last detected in the session.
Last Query ID
The ID of the last query that was running before the session became idle. If the session is active, this displays the ID of the running query. To view the query text, hover your mouse over the ID.
Using the Query Monitor Controls for Queries
You can use the Query Monitor to display basic information about queries, cancel or export queries, see a query’s details, and reassign the query to a different resource group.
In addition, you can pause the query monitor to see a snapshot of all running queries, filter queries by their status, and perform an advanced search of queries.
General Tasks
-
If a query shows the Blocked status, use the tooltip to display the transaction that is blocking the query.

-
Click a column heading to sort the rows on that column in ascending or descending order.
-
Click the checkbox at the left of a row to choose a query to cancel or export. Click the checkbox in the heading row to choose all queries.
-
Click CANCEL QUERY to cancel selected queries. A pop-up box prompts you to enter a reason. Enter the error message (max 128 characters) displayed to users whose sessions are cancelled.
-
Click EXPORT to download a comma-separated values (CSV) text file containing rows for the selected queries. When no queries are selected, all rows are exported. The default file name is
spreadsheet.csv. -
Click any query ID to see the Query Details, including metrics, the text of the query, and the query plan.
Pausing and Resuming the Query Monitor
You can pause the Query Monitor to view a snapshot of running queries, and then resume the Query Monitor. This allows you to see the status of a query before it disappears from the query list.
-
To pause the Query Monitor, click the Pause Query Monitor button. When you pause the Query Monitor, Command Center displays a warning message that the queries you are viewing are not up to date.
-
When you pause the Query Monitor, the query list stops refreshing. Pausing the Query Monitor merely suspends the UI data stream, it does not pause query execution. When you resume monitoring, you will see the updated state, which means some queries may disappear immediately if they are already done.
-
You can click a Query ID to display the Query details page. The information on this page continues to be updated in real time.
-
When you are viewing the details of a query that completed after pausing the Query Monitor, you will see two possible pages:
-
For queries already saved to Query History, the displayed information matches that of the Query History page.
-
If the query is not already saved to query history, you will see a temporary page containing some outdated information, as well as a warning message requesting that you reload the page.
-
-
While the Query Monitor is paused, if you click on a Query ID to view that query’s details, when you return to the Query Monitor some data will have been updated, including Status, Spill File Size, and CPU Time. If a query has completed, it will no longer appear on the list.
-
To resume the Query Monitor, click the Resume Query Monitor button.
Filtering Queries
You can filter queries to show any combination of running, queued, and blocked queries. In addition, using the Advanced Search button, you can filter queries by a variety of other attributes.
-
To filter by Status, select or deselect the Running (green), Queued (yellow) or Blocked (red) buttons. When the colored dot is solid, the Query Monitor displays queries with that status. When empty, the Query Monitor hides queries with that status.
For example, if the Running and Queued dots are solid but the Blocked dot is empty, the Query Monitor displays running and queued queries but not blocked queries.
-
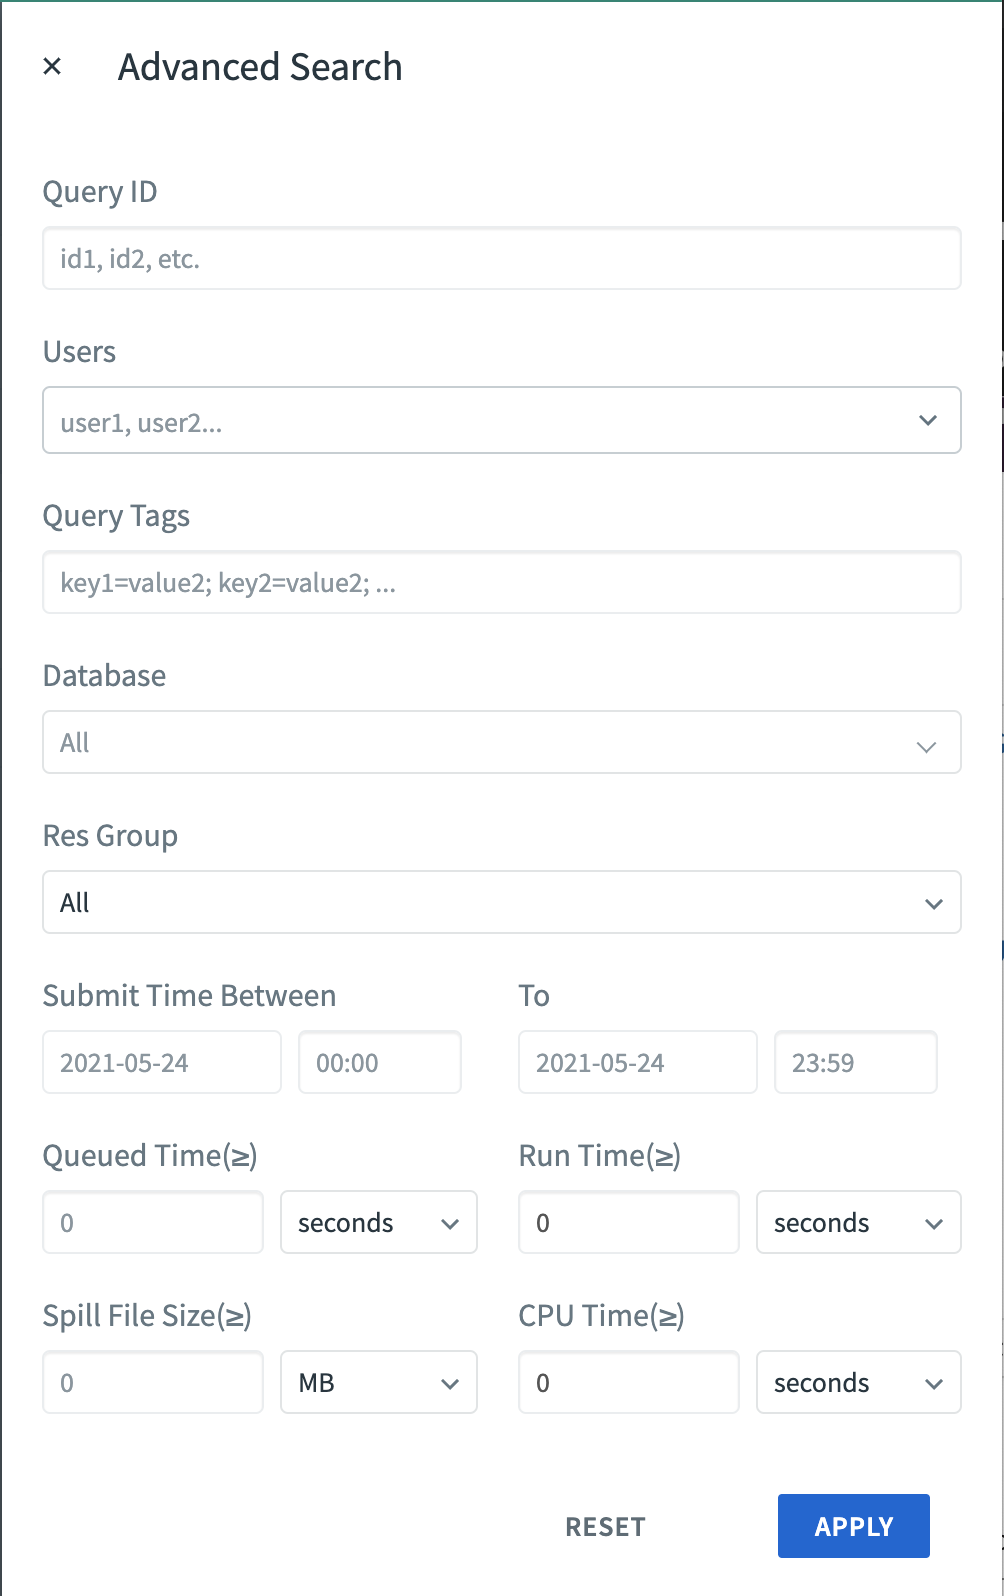
To filter query results using Advanced Search, click the Advanced Search button and then select the criteria for the search.

Query ID
Returns the query or queries identified by the string or strings entered. Separate multiple query ids with commas.
Users
Returns queries owned by the specified users.
Query Tags
Returns queries whose query tags match the values entered. Enter the tags as key-value pairs. Separate multiple query tags with semicolons. Not available in Command Center 4.x.
Database
Returns queries that are running against the specified database.
Res Group
Returns queries executed by the specified resource queue or resource group.
Submit Time (>=)
Returns queries that were submitted in the window of time specified.
Queued Time (>=)
Returns queries that have been in queue awaiting execution for at least the specified amount of time. You may specify in seconds, minutes, or hours.
Run Time (>=)
Returns queries that have been running for at least the specified amount of time. You may specify in seconds, minutes, or hours.
Spill File Size (>=)
Returns queries that generated spill files of the specified size. You may specify in MB, GB, or TB.
CPU Time (>=)
Returns queries that have consumed the specified amount of CPU time. You may specify in seconds, minutes, or hours.
Click APPLY to display results that match your criteria. The number of conditions will be retained until you click RESET.
Using the Query Monitor Controls for Sessions
-
Click a column heading to sort the rows on that column in ascending or descending order.
-
Click the checkbox to the left of a row to choose a session to cancel or export. Click the checkbox in the heading row to choose all sessions.
-
Click the checkbox just above the Session ID column labeled “Show idle in transaction Only” to display only the sessions whose status is idle in transaction.
-
Click CANCEL SESSION to cancel selected sessions. A pop-up box prompts you to enter a reason. You can enter a message of up to 128 characters to display with the error message that is received by users whose sessions are cancelled.
Note: You cannot cancel sessions whose Status is active. -
Click EXPORT to download a comma-separated values (CSV) text file containing rows for the selected sessions. When no sessions are selected, all rows are exported. The default file name is
spreadsheet.csv.