


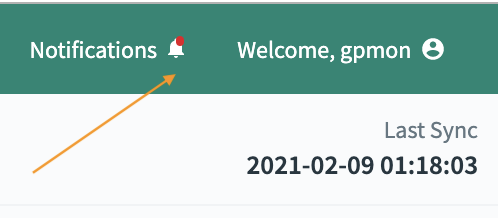
To quickly view any notification alerts, use the Notifications label on the header bar of the Command Center dashboard.
When you open the Notifications window, unread notifications are highlighted in light blue. The alerts are ordered by time and are kept for 7 days. When you close the Notifications window, all alerts are considered read.
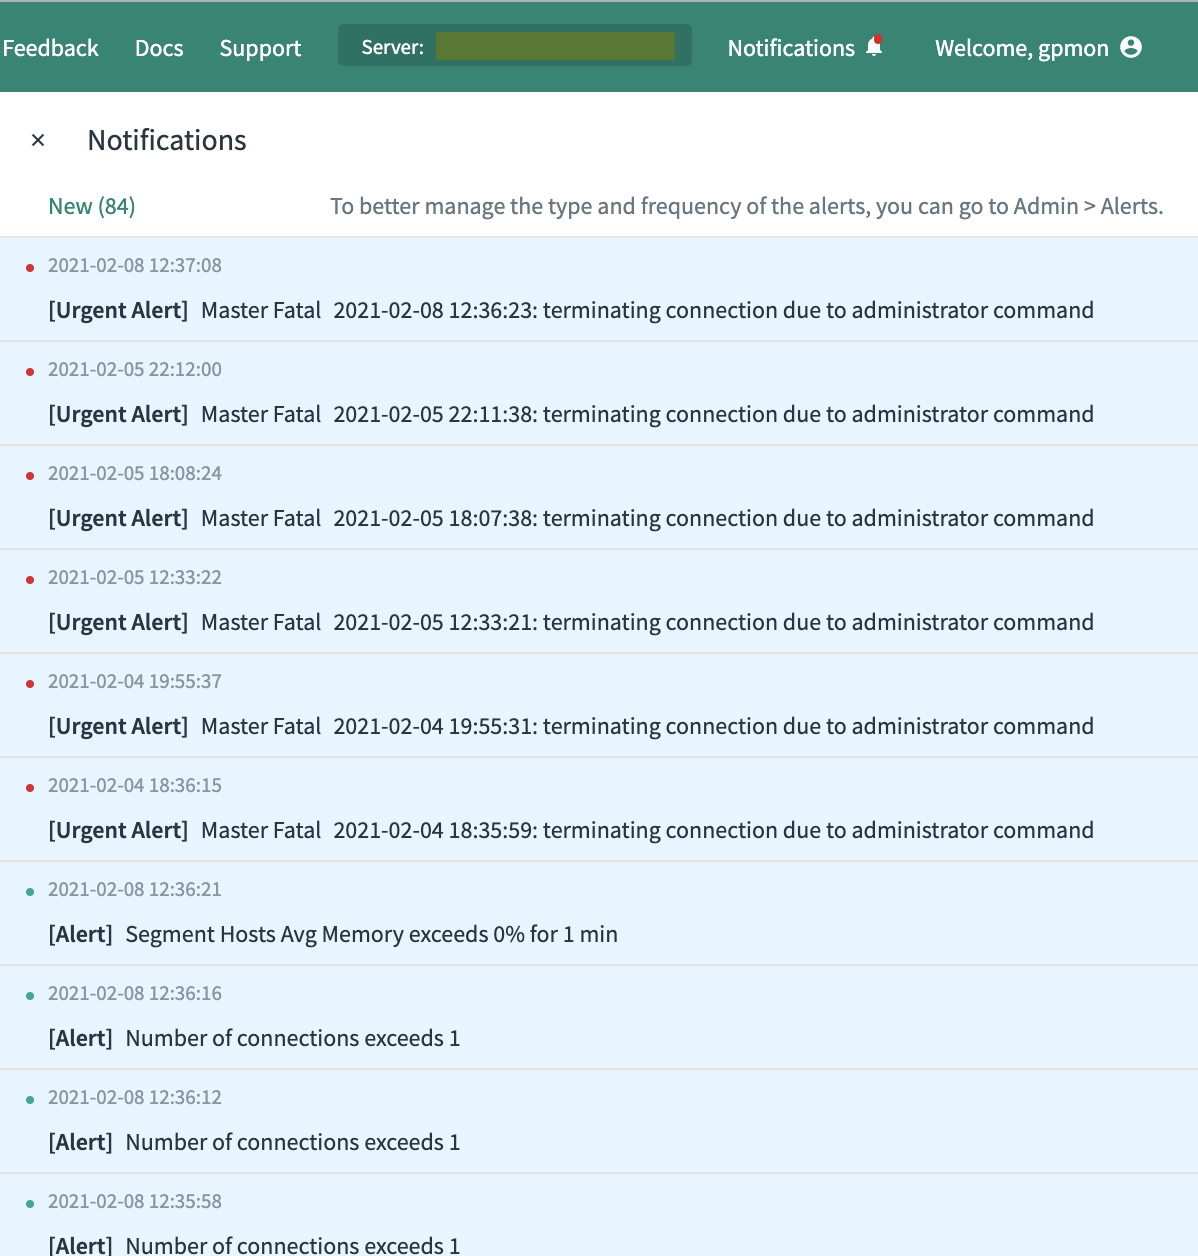
To customize the alert notifications, go to the Admin> Alerts page, where an administrator can set up alert rules. The rules help detect and respond to events that occur in the Greenplum Database system and in currently executing database queries. When a rule is matched, Command Center logs a record.
You can set up email alerts by configuring an SMTP server in Greenplum Database or in Command Center. Additionally, you can create a send_alert.sh shell script to forward alerts to other destinations, such as an SMS gateway or a Slack channel. If the script is present, Command Center runs it whenever an alert is raised.
Command Center creates the gpmetrics schema in the gpperfmon database to store both rules and log records. See gpmetrics Schema Reference for information about the gpcc_alert_rule and gpcc_alert_log tables in the gpmetrics schema.
This topic contains the following subtopics:
Configuring Alert Rules
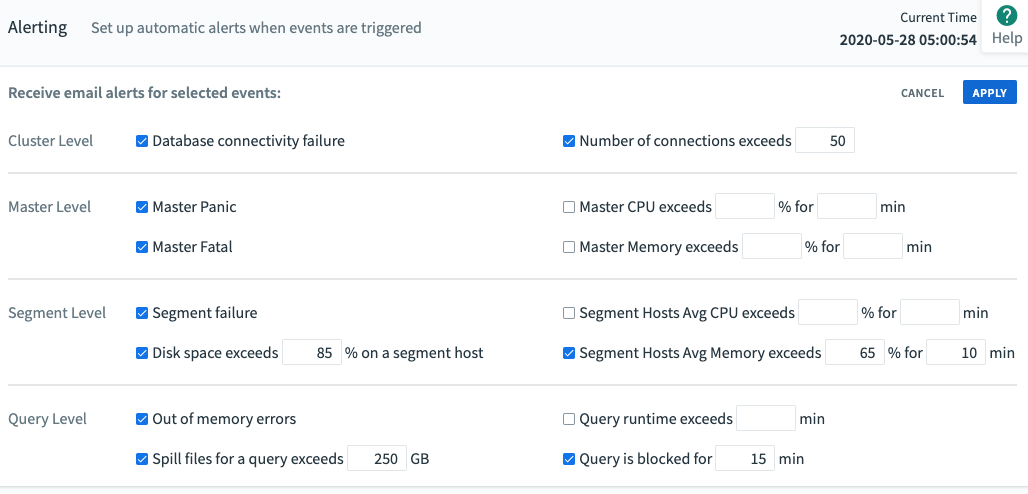
Click EDIT to manage alert event rules. To enable an alert rule, enter any data required in the fields and check the box. Uncheck the box to disable the rule. Click ALERT when you have finished making changes to the alert configuration.
Cluster Level
Database connectivity failure
An alert is raised when either of these conditions is detected:
- Command Center is running on the master host, the master host is up, but the database is down or cannot be reached.
- Command Center is running on the standby master host, the standby master host is up, but the master host is down or cannot be reached, or the database is down or cannot be reached.
Command Center checks three times before raising the alert.
If the host where Command Center should be running is down, no alert is raised.
Number of connections exceeds [N]
An alert is raised when the total number of database connections exceeds the number specified. The number of connections is checked every 30 seconds. After an alert is raised, the metrics collector checks the number of connections every 30 minutes until the number of connections drops below the threshold, and then it resumes checking every 30 seconds.
Master Level
Master Panic
An alert is raised when messages with PANIC severity are detected at the master host. An PANIC error causes all database sessions to abort.
Master Fatal
An alert is raised when messages with FATAL severity are detected at the master host. A FATAL error causes the current session to abort. To reduce noise, fatal messages logged due to password authentication errors do not raise alerts.
Master CPU exceeds [%] for [N] min
An alert is raised when the CPU usage on the master host exceeds the specified percentage for the specified number of minutes. Command Center samples CPU usage on the master host every 15 seconds and calculates the mean of the samples.
Master Memory exceeds [%] for [N] min
An alert is raised when the percent of memory used on the master host exceeds the specified percentage for the specified number of minutes. Command Center samples memory usage on the master host every 15 seconds and calculates the mean of the samples. Only memory in use is considered; memory for buffers and cache is not included.
Segment Level
Segment failure
An alert is raised when one or more failed segments are detected. After the alert email is raised, Command Center will raise the alert every 30 minutes until the segments are recovered.
Total disk space exceeds [%] on a segment host
An alert is raised when the total of disk space in use for all segment hosts exceeds the specified percentage. Command Center gathers the available disk space and total disk space from each segment host in the Greenplum Database cluster. The percent of total disk space in use is calculated by the following formula:
100 - sum(<available disk space>) / sum(<total disk space>) * 100
A disk space alert is raised no more than once every 24 hours.
Segment Hosts Avg CPU exceeds [%] for [N] min
An alert is raised when the average percent of CPU used for all segment hosts exceeds the specified percentage for the specified number of minutes. Command Center samples all segment hosts every 15 seconds and calculates the mean of the samples.
Segment Hosts Avg Memory exceeds [%] for [N] min
An alert is raised when the average memory for all segment hosts exceeds the specified percentage for the specified number of minutes. Command Center samples all segment hosts every 15 seconds and calculates the mean of the samples. Only memory in use is considered; memory for buffers and cache is not included.
Query Level
Out of memory errors
An alert is raised when an executing query fails with an out of memory (OOM) error. Note that no alert is raised if there is insufficient memory to start the query.
Spill files for a query exceeds [N] GB
An alert is raised when the total disk space consumed by a running query’s spill files exceeds the specified number of gigabytes. An alert is raised only once per query.
Query runtime exceeds [N] min
An alert is raised when a query runtime exceeds the number of minutes specified. This alert is raised just once for a query.
Query is blocked for [N] min
An alert is raised if a query remains in a blocked state for longer than the specified number of minutes. If an alert is raised, and then the query unblocks, runs, and blocks again for the specified time, an additional alert is raised. Blocked time excludes the time a query is queued before it runs. It is possible for a “Query runtime exceeds [N] min” rule to also trigger while a query is blocked.
Configuring Alert Email
Command Center requires an SMTP server to send alert emails.
Command Center first attempts an encrypted TLS connection and then falls back to an unencrypted connection if TLS is not supported. The SMTP server must support one of the following authentication methods: NONE, PLAIN, LOGIN, or CRAM-MD5. Command Center will use the most secure of these methods the SMTP server allows.
Configuring email With Command Center
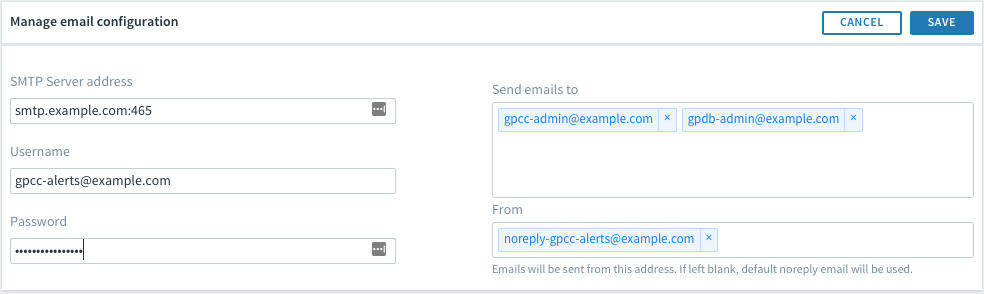
Click EDIT in the Manage email configuration panel.
The alert email configuration is set with the following Greenplum Database server configuration parameters:
SMTP Server address
The name or IP address of the SMTP server and the SMTP port number. The port number is typically 587 for connections with TLS encryption or 465 without encryption. Example: smtp.example.com:465
Username
The username of the account to authenticate with the SMTP server. This is an optional field, only required if the SMTP server requires a username for authentication. Example: [email protected]
Password
The password for the SMTP username. For security, the password is masked. This field is optional, only needed if the SMTP server requires a username and password for authentication.
Send emails to
To add an address to the list, enter the address and press Enter. To remove an email address, click the X on the address.
From
The email address to use for the From: address in the alert email. Example: [email protected].
If you leave this field blank, Command Center uses the default value, [email protected].
When you click SAVE, Command Center sends a test email to the addresses in the Send emails to field. The email contains a list of the currently configured alert rules. If there is an error in the SMTP server or username/password configuration and the email cannot be sent, Command Center displays an error message.
Configuring email for Greenplum Database
The following server configuration parameters are used to configure SMTP email for Greenplum Database.
gp_email_smtp_server
The SMTP server and port. Example: smtp.example.com:465
gp_email_smtp_userid
The name of a user to authenticate with the SMTP service. Example: [email protected]
gp_email_smtp_password
The password for the SMTP user.
gp_email_from
The email address to set as the email sender. Example: [email protected]
gp_email_to
A semicolon-separated list of email addresses to receive alert messages. Example [email protected];[email protected]
Command Center uses the gp_email_smtp_server, gp_email_smtp_userid, and gp_email_smtp_password parameters if they are set. It ignores the remaining parameters.
You can check the current value of a configuration parameter by running the gpconfig -s command on the master host, for example:
$ gpconfig -s gp_email_smtp_server
Use the gpconfig -c option to set the values of server configuration parameters, for example:
$ gpconfig -c gp_email_smtp_server -v "smtp.example.com:465"
$ gpconfig -c gp_email_smtp_userid -v "[email protected]"
$ gpconfig -c gp_email_smtp_password -v "changeme"
$ gpconfig -c gp_email_from -v "[email protected]"
$ gpconfig -c gp_email_to -v "[email protected];[email protected]"
Run gpstop -u to reload the configuration files after changing these configuration parameters.
Creating a Send Alert Script
The send alert script is a shell script that you can use to send Command Center alerts to destinations such as SMS gateways, pagers, team collaboration tools like Slack, chat servers, archive files, alternative email servers, and so on. You can use the send alert script in addition to sending email from Command Center, or as an alternative to sending alert emails from Command Center.
Command Center looks for the script $HOME/gpmetrics/send_alert.sh on the host where Command Center is running—either the master host or standby host. If the file exists and is executable by the gpadmin user, Command Center executes the script. The following variables are set on the command line when the script runs.
| Variable | Description |
|---|---|
| LINK | URL of the Greenplum Command Center web server. |
| QUERYID | ID of the query, if the alert was triggered by a query. |
| SERVERNAME | Name of the Greenplum Command Center server. |
| QUERYTEXT | The text of the query, if the alert was triggered by a query. |
| ACTIVERULENAME | Current text the of rule, with user-specified values included. |
| LOGID | Value of this alert’s id column in the gpmetrics.gpcc_alert_log table. |
| RULEDESCRIPTION | Text of the rule, including user-specified values, at the time the alert was raised. |
| ALERTDATE | Date the alert was raised. |
| ALERTTIME | Time the alert was raised. |
| SUBJECT | Subject line for email. |
An example script that you can customize is provided at $GPCC_HOME/alert-email/send_alert.sh.sample. The example formats the alert as HTML email text and pipes it through the Linux mail command.
To set up a send alert script:
-
Copy the
$GPCC_HOME/alert-email/send_alert.sh.samplefile to$HOME/gpmetrics/send_alert.sh. -
Customize the script with code to format and deliver the alert to your desired destination.
-
Run
gpcc startto restart Command Center and enable the script.
