


The Query Details view displays query metrics, the text of the query, query tags, information about inner queries, and the query plan and progress for a single query selected from the Query Monitor view.
Query Execution Metrics
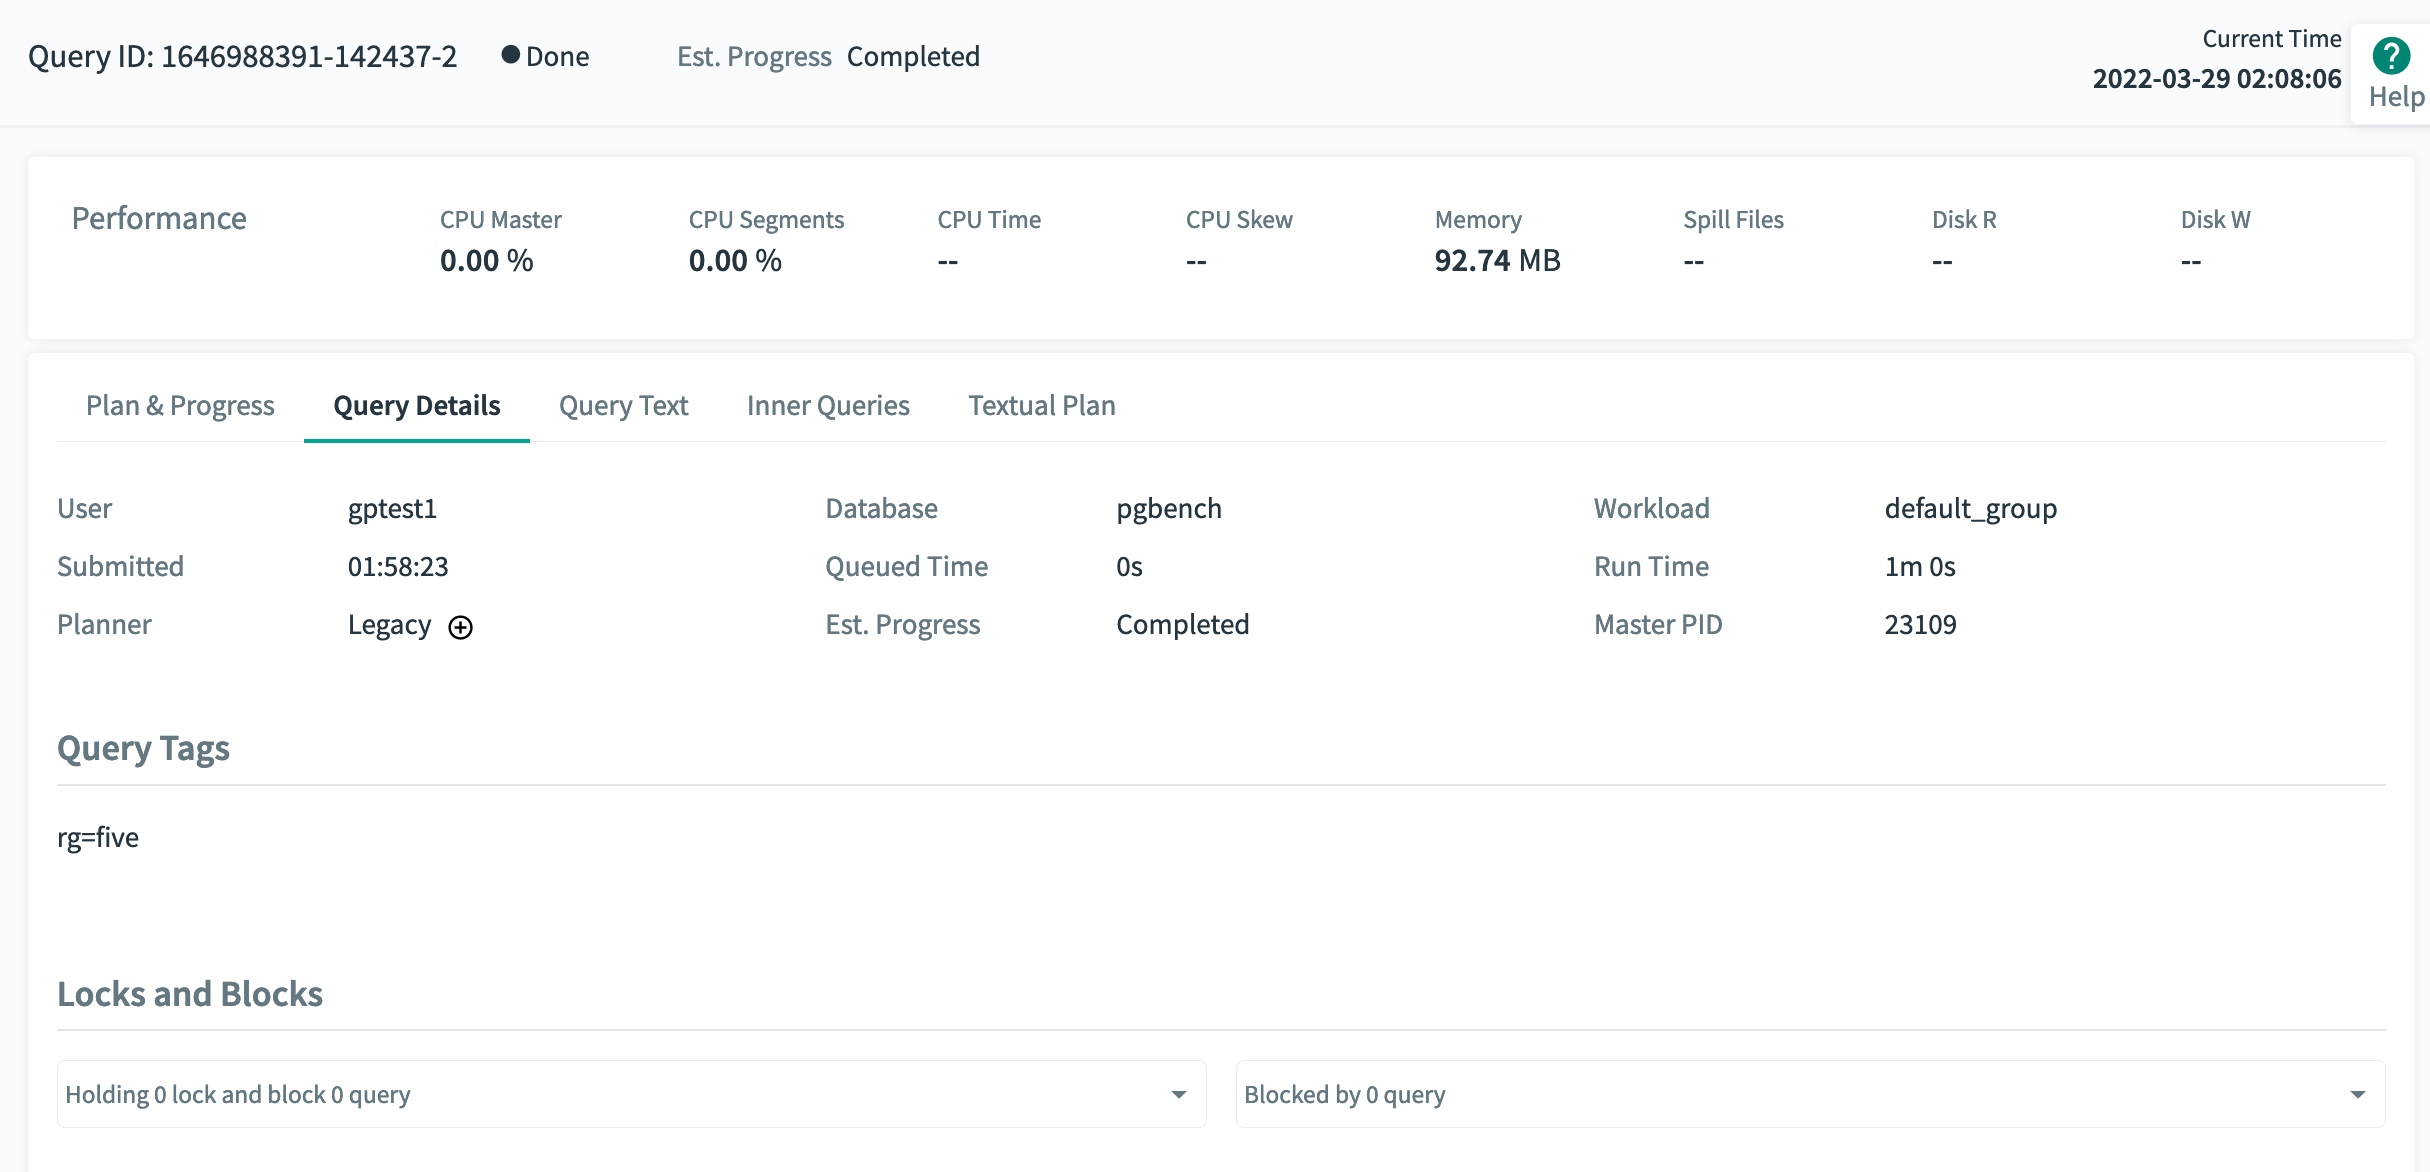
The Query ID, execution status, and run time of the query are displayed at the top.
The following metrics are displayed for the query.
User
The Greenplum Database role that submitted the query.
Database
The name of the database that was queried.
Workload
The name of the resource group or resource queue that is managing the query.
Planner
The name of the query planner used for this query, GPORCA or Legacy.
Submitted
The time the query was submitted to the query planner.
Queued Time
The amount of time the query has been (or was) in queue awaiting execution.
Master PID
The query's process ID on the master host.
Run Time
The amount of time since query execution began.
Est. Progress
An estimate of the percentage of the query execution completed. The estimate is calculated from row count and cost estimates generated by either the GPORCA or legacy planner for the particular query and the available statistics. The estimate does not account for the many other factors that can affect query execution so it should not be seen as a reliable predictor of query completion time.
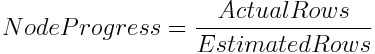
The progress for each plan node is calculated as the ratio of actual rows produced to the planner's estimate of the total number of rows the node will produce:
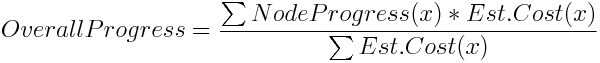
The overall progress for the query is estimated using the calculated node progress and the planner's cost estimates:
If the estimate is greater than 100% and the query has not yet completed, 99.9% completion is reported. 100% is reported if the formula produces an estimated percentage greater than 100%.
CPU Master Current CPU percent on the Greenplum Database master host for this query.
CPU Segments
(Active queries only.) Current CPU percent average for all segment processes executing this query. The percentages for all processes running on each segment are averaged, and then the average of all those values is calculated to render this metric. Current CPU percent average is always zero in historical and tail data. The master and standby master are excluded from the calculation.
CPU Time
Total CPU time consumed by all processes on all segments executing this query.
CPU Skew
The amount of CPU skew. CPU skew occurs when query executor processes for one segment use a disproportionate amount of CPU compared to processes for other segments executing the query. This value is calculated as
1 − (average_segment_CPU / maximum_segment_CPU)
Memory
Memory consumed by all segment processes executing the query.
Spill Files
The total size of spill files created for the query. Greenplum Database creates spill files when there is insufficient memory to execute the query in memory. See Managing Spill Files Generated by Queries for information about spill files.
Disk R
The current average disk read rate for all segment hosts.
Disk W
The current average disk write rate for all segment hosts.
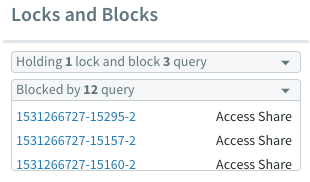
Locks and Blocks
Contains two lists of locks currently blocking transactions. Click a list to expand and view the contents.
A list of locks held by this query, including the type of each lock and the queries blocked by that lock.
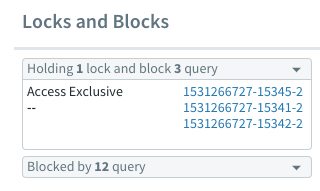
A list of queries that hold locks that block this query and the lock type.
Query Text, Query Tags, Inner Queries, and Execution Plan
The query text, the query's tags, statements within the function(s) the query calls -- "inner queries", and the query's plan and execution progress are shown in the lower panels of the Query Details view.
Query Text
The Query Text panel displays the text of the query as it was submitted to Greenplum Database.
Command Center can display up to 100K characters. If you click COPY, up to 100K characters of the query text are copied to the clipboard.
If the query text is longer than 100K characters, a message is displayed with a link you can use to download the full text of the query. The name of the text file is the ID of the query with a .txt extension. The file is available to download for 24 hours after the query completes, or until the query has been saved to history, once history collection is enabled.
Query Tags
The Query Tags panel displays the tags associated with the query.
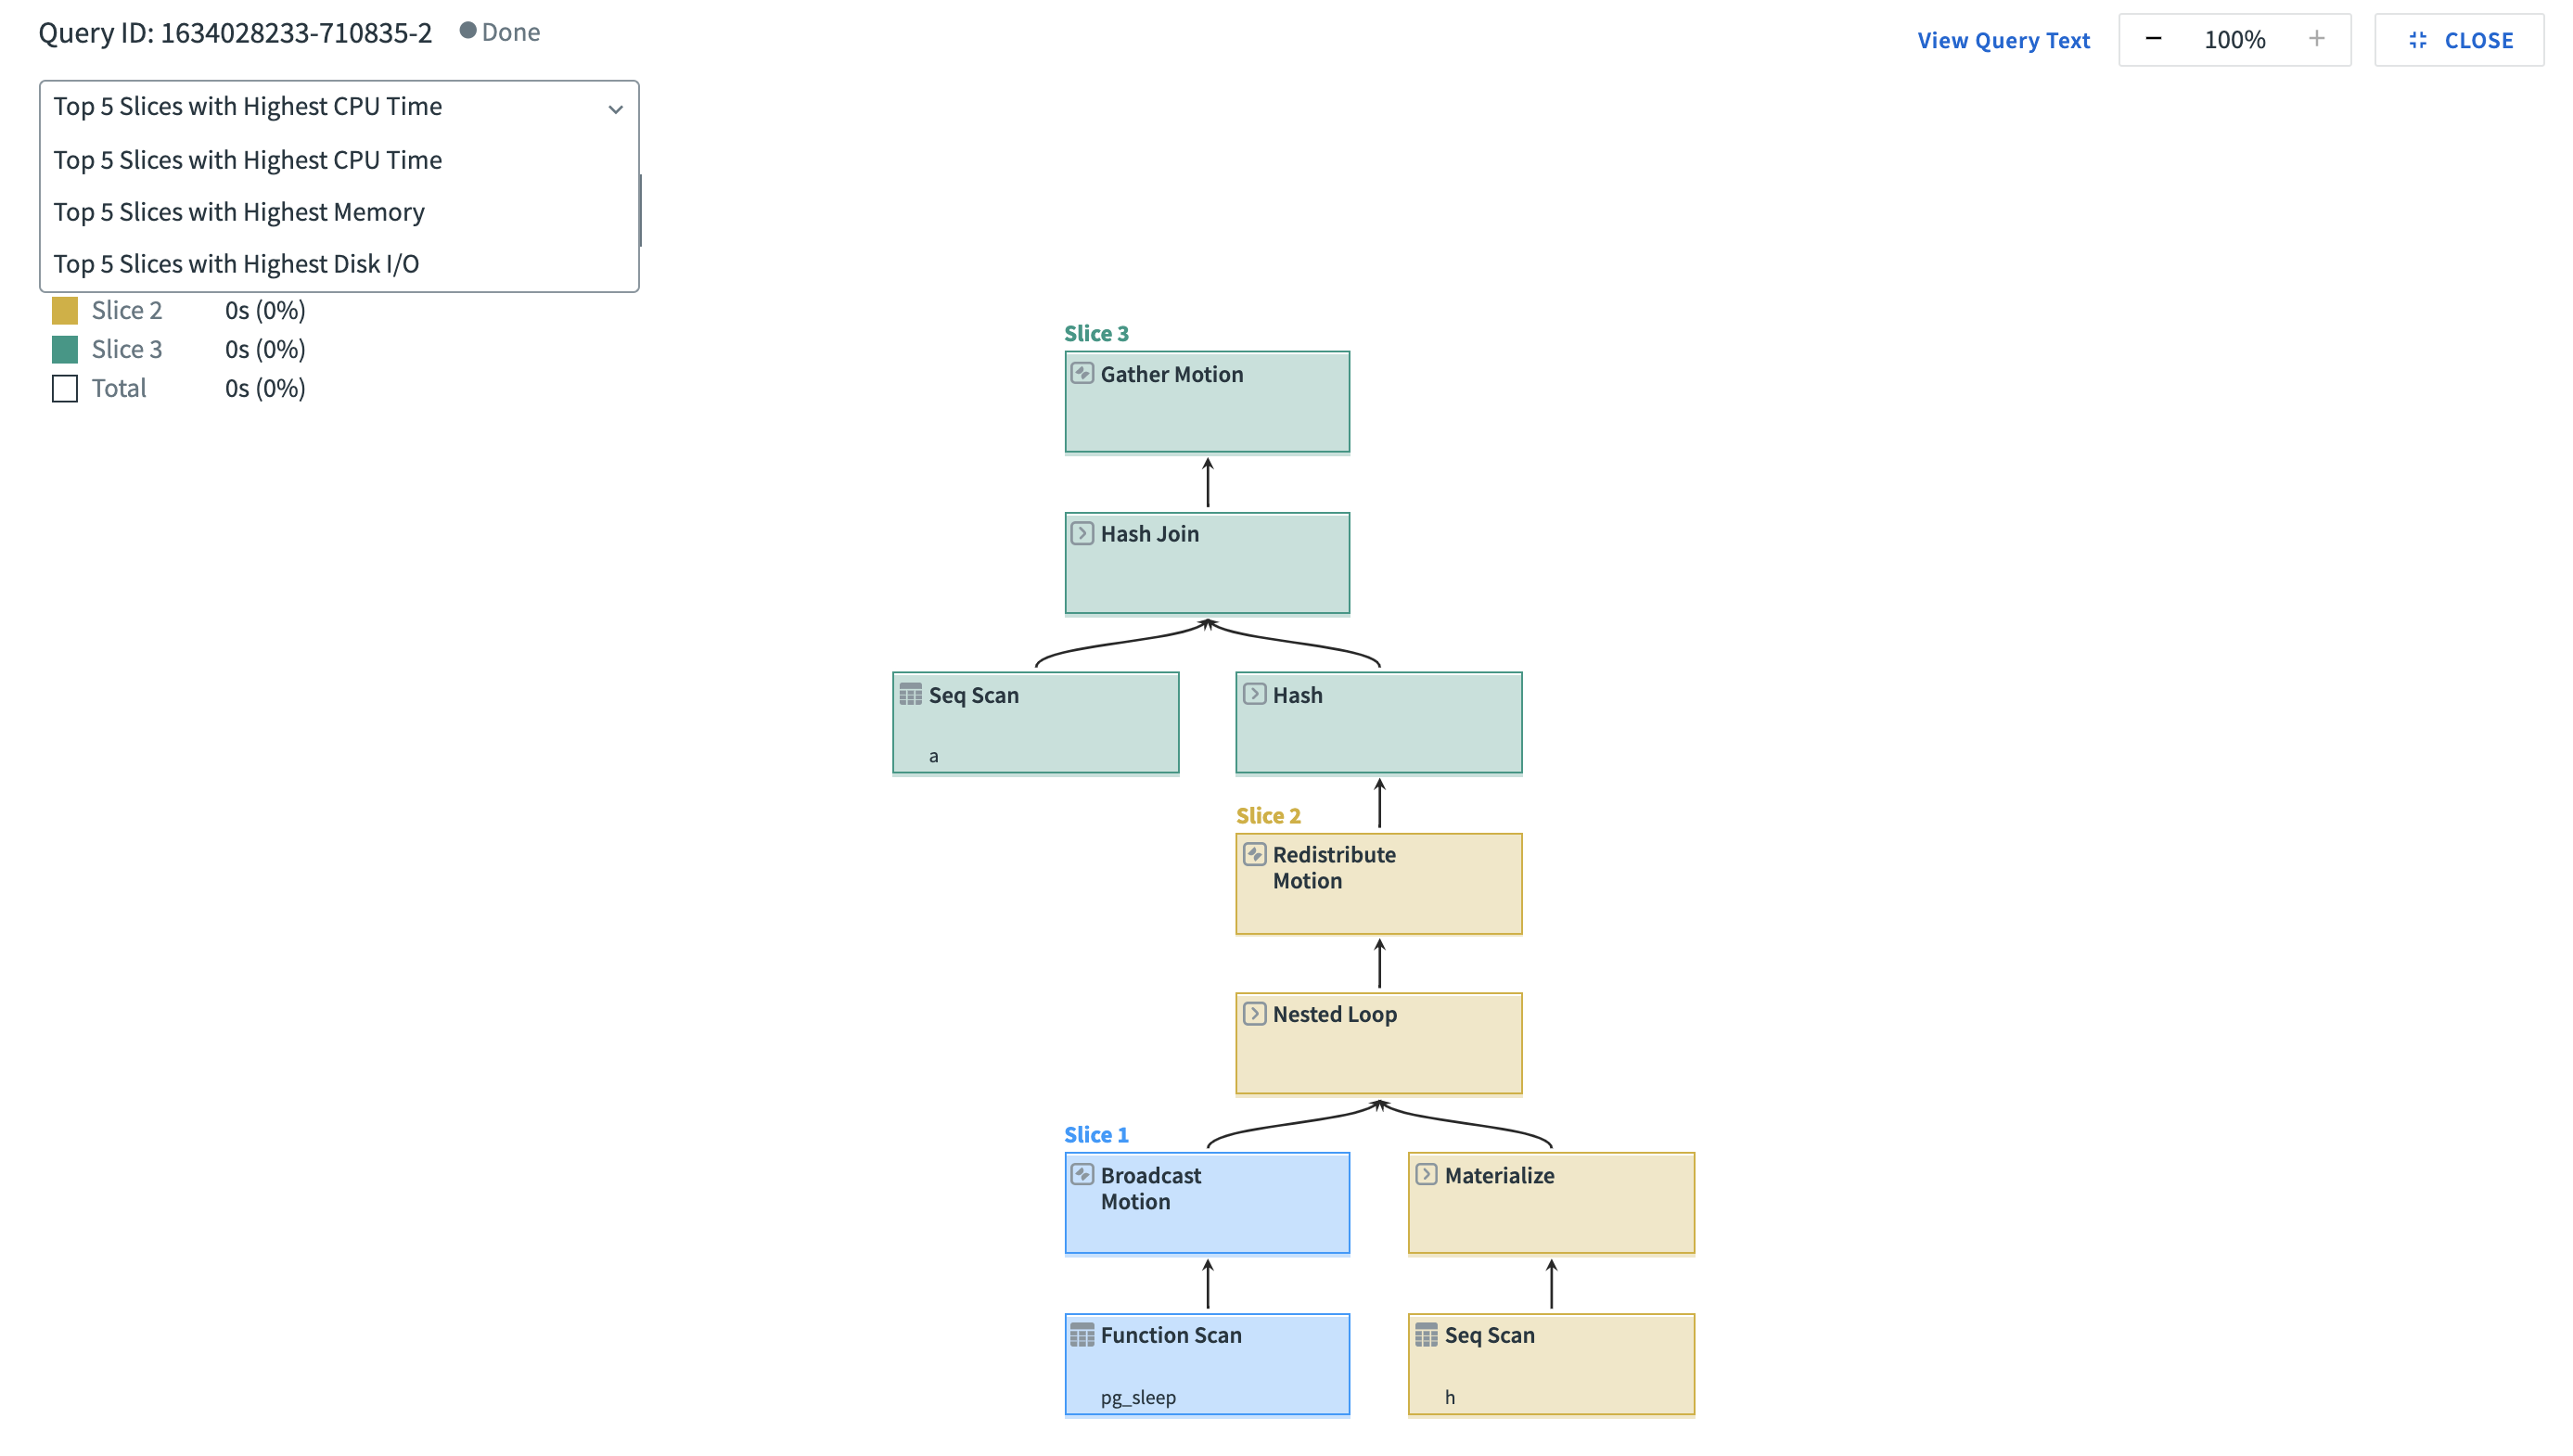
Query Plan and Progress
The Plan & Progress tab in the lower right panel is a graphical representation of the query plan with animation and real-time metrics to show execution progress. Each box in the tree represents a step in the query execution plan. The boxes are labeled with the operation they represent and have a CPU usage metric. Query execution begins at the bottom of the tree and ends at the top.
Before a step begins to execute, the box has a solid white fill. When the step becomes active, the box is animated with a green and white fill to indicate that the operator is working. When the step has completed, the box has a solid green fill.
Query execution plans are executed in "slices," portions of the query plan that segments can work on independently in parallel. The plan is sliced wherever a data motion operator occurs. The time displayed in the upper right corner of each box is the amount of CPU time used for all steps in the slice to which the step belongs. Each slice is displayed in its own color, making it easy to distinguish the slices from each other. The visual query plan does not illustrate slices, but you can find information about slices in the textual plan.
If you click a step, the box expands to show additional details.
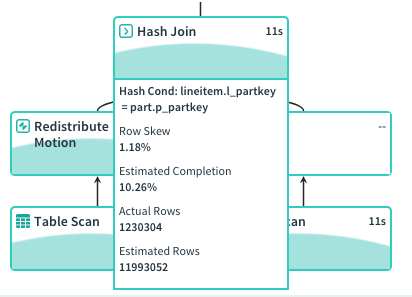
The expanded plan box contains the following metrics.
- The type of operator. When the operator is a table scan, the name of the scanned table is included. See Query Plan Execution for descriptions of the operators.
- Information related to the current operation, such as the hash key, merge key, join condition, or filter condition.
- Row Skew - the amount of row skew for the current operator, a value from 0% to 100%. Row skew occurs when some segments process more rows than other segments. The percentage is calculated as
(1 − (average_segment_rows / maximum_segment_rows)) * 100. Nodes with a row skew of greater than 30% are marked with an exclamation point. - Estimated Completion - the current percentage of actual rows to estimated rows for this plan step. The percentage can exceed 100% if the operation produces more rows than the optimizer's estimate. The percentage changes to "Completed" when the operation completes.
- Actual Rows - The current number of rows produced by this step. Note that for nested join operators, the Actual Rows is estimated since the actual row counts are not available while the join is executing.
- Estimated Rows - The estimated number of rows the operator will produce.
Display Slice Metrics
From within the Plan and Progress tab you may display key metrics about slices, including:
- the top 5 slices that consume the most CPU time
- the top 5 slices that consume the most memory
- the top 5 slices that use the most disk I/O
To display this information, click the Expand button on the far right. This displays a screen with a dropdown menu from which you can choose which slice metrics you want to display:
Inner Queries
The Inner Queries panel is disabled by default, which means the panel is blank. When enabled, it shows statements being called by the function(s) the query calls. Command Center displays a series of non-continuous snapshots of statements being executed, rather than a continuous execution flow. To enable this panel, set the gpcc.enable_send_inner_query server configuration parameter to true.
Textual Plan
Select the Textual Plan tab and click RUN EXPLAIN to generate the text representation of the explain plan.
Note: The RUN EXPLAIN button is dimmed if Command Center is unable to generate the explain plan. Command Center is unable to generate the explain plan if the size of the query text is greater than 100K characters or if the query text contains multiple statements.
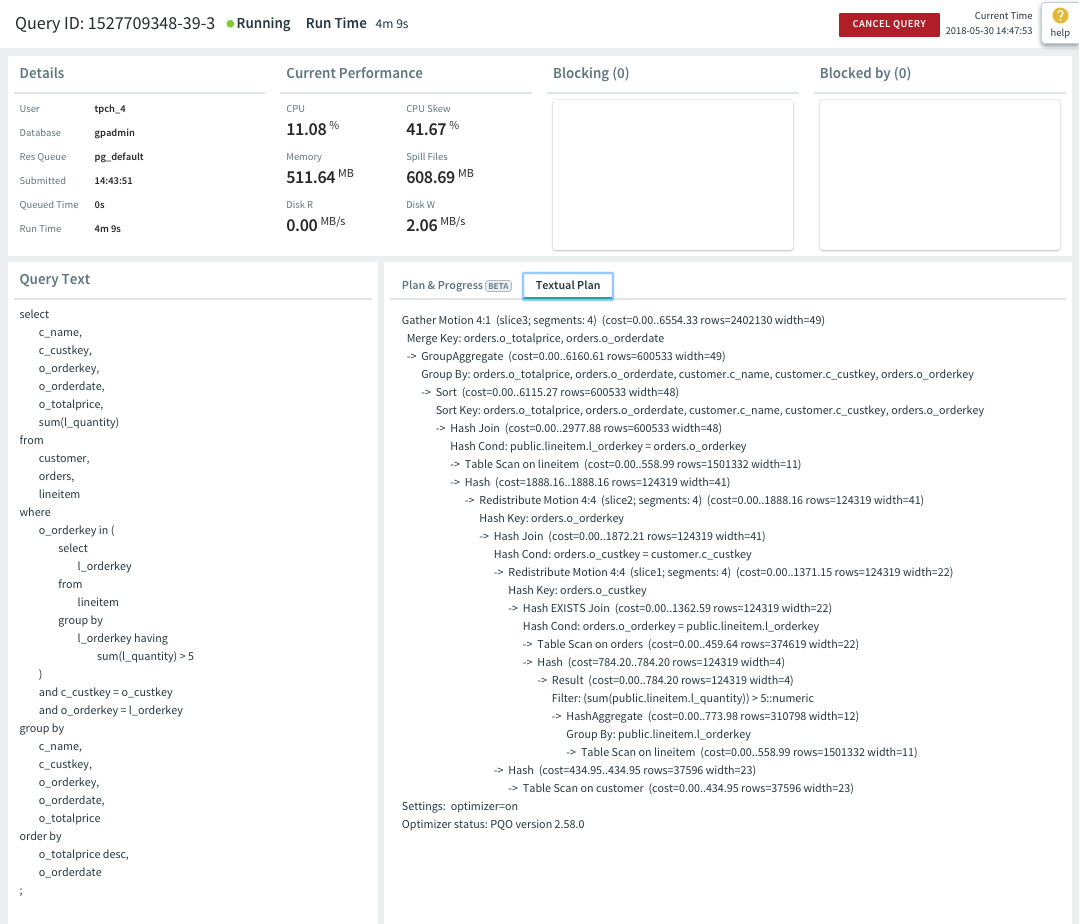
The textual plan is the output of the Greenplum Database EXPLAIN command for the query. The query plan steps are labeled with arrows (->) and the structure of the query plan tree is indicated with indentation.
The Optimizer status: line at the bottom of the textual plan reports whether the explain plan was generated using the GPORCA optimizer (PQO) or the legacy query optimizer.
For help reading the textual explain plan see the EXPLAIN command in the Greenplum Database Reference Guide and Query Profiling in the Greenplum Database Administrator Guide. See Query Execution for descriptions of the query operators.
