


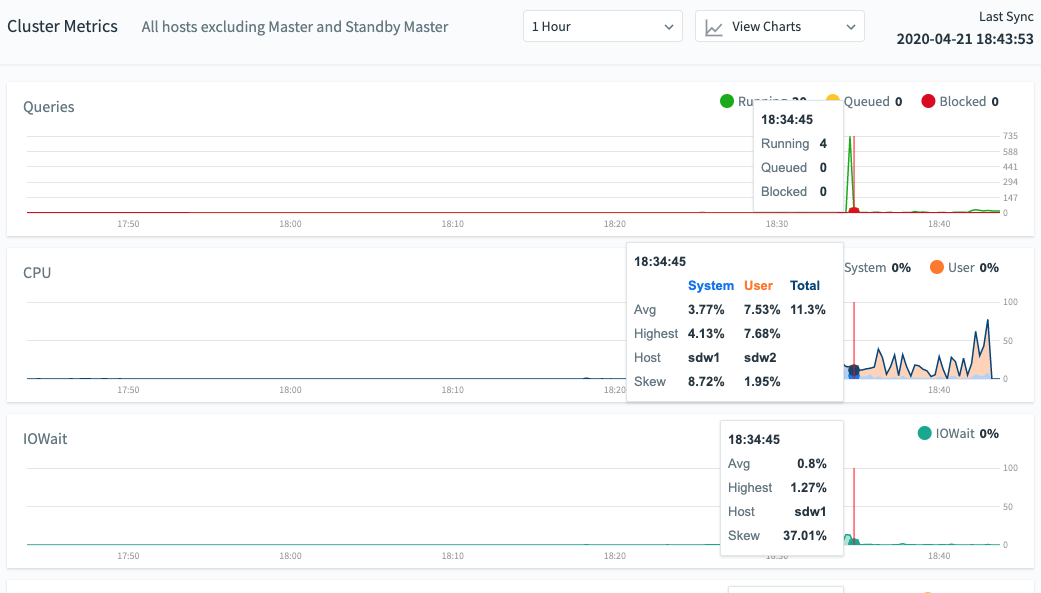
The Cluster Metrics page shows consolidated statistics for all segment hosts in the Greenplum cluster. Master and standby master hosts are excluded from the metrics.
Use the Show/hide Charts control to choose which charts to display.
Choose the time period to display using the control in the top right corner of the screen: 1 hour, 4 hours, 1 day, or 3 days. The right side of the chart corresponds to the Last Sync time shown in the top right of the page.
Hover over any of the charts to see values for that point in time in pop-up boxes. The charts are synchronized so that hovering over any chart shows the same point in time in all charts.
The master and standby master hosts are excluded from the metrics.
When the metric is an average of values collected from all segment hosts, the host with the highest value is identified in the pop-up box.
Solid lines trace the average value for all segment hosts. The stacked graphs represent the highest values for the metric at each point in time.
The current value of a metric is shown in the upper right corner of its chart.
The page has charts for the following metrics:
Queries
The number of queries running and the number of queries queued to run.
CPU
The percentage CPU used by system processes and the percentage CPU used by user processes. The chart represents the total of system and user CPU usage across the hosts. The system percentage includes IOWait time. Note that this is different than the CPU system percentage on the Host Metrics page, where IOWait time is not included in the system time.
IOWait
The percentage of CPU used waiting on IO requests.
Memory
Percentage of memory in use.
Memory is calculated as follows:
Total = MemTotal
Free = MemFree + Buffers + Cached
Used = MemTotal - Free
Disk I/O
Disk read and write rates in megabytes per second.
Network
Network I/O read and write rates in megabytes per second. Network metrics include traffic over all NICs (network interface cards), including internal interconnect and administrative traffic.
Load
System load average for 1-minute, 5-minute, and 15-minute periods.
Swap
Percentage of swap space used.
