


The Host Metrics page displays a table of the hosts in the cluster with statistics collected at the most recent quantum interval.
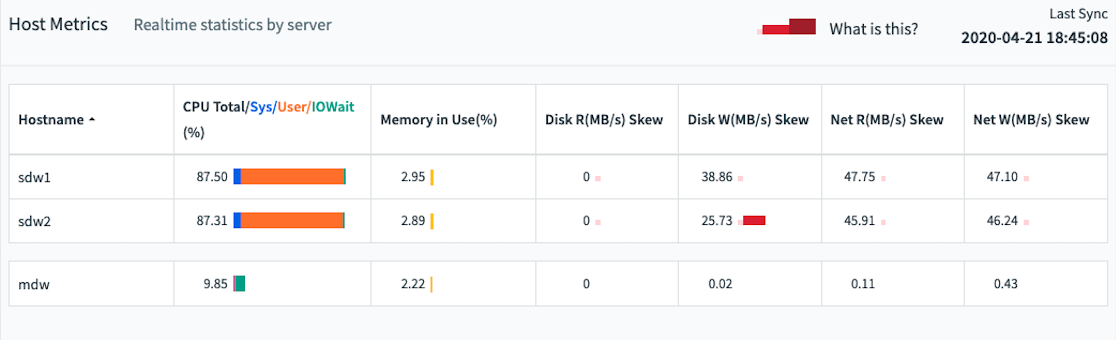
At the top right, Last Sync displays the time the statistics were last updated.
Click a column header to sort the table by that column. Click again to toggle between ascending and descending sort. Master and standby hosts are not included in the sort and are always displayed following the sorted list of segment hosts.
For each server, the following columns are displayed:
Hostname
The hostname name of the server.
CPU Total/Sys/User/IOWait (%)
The CPU column shows the total percentage of CPU used for system processes, user processes, and IOWait. Hover over the table cell to show the percentages for each of these CPU modes, as well as the idle time.
When comparing Command Center CPU values with other unix utilities like top, there are slight differences.
To compare Command Center CPU user time with top, adjust the top CPU user time to be: CPU user time + nice time. To compare CPU sys time, before Command Center 4.9/6.1, adjust the top utility CPU sys time to be: sys time + iowait time. After 4.10/6.2, the values are similar, for example CPU sys = sys and CPU IOWait = iowait.
Memory In Use (%)
The percentage of host memory in use is displayed next to a graph illustrating the memory in use and available. Hover over the table cell to see memory used and available in gigabytes.
Memory is calculated as follows:
Total = MemTotal
Free = MemFree + Buffers + Cached
Used = Total - Free Disk R (MB/s) | Skew Disk read rate in megabytes per second is displayed next to a graph of calculated disk read skew. Hover over the table cell to see a Low/Medium/High rating for disk skew.
Disk W (MB/s) | Skew Disk write rate in megabytes per second is displayed next to a graph of calculated disk write skew. Hover over the table cell to see a Low/Medium/High rating for disk write skew. Net R (MB/s) | Skew Network read rate in megabytes per second is displayed next to a graph of calculated network read skew. Hover over the table cell to see a Low/Medium/High rating for network read skew. Net W (MB/s) | Skew Network write rate in megabytes per second is displayed next to a graph of calculated network write skew. Hover over the table cell to see a Low/Medium/High rating for network write skew.
About Skew Calculations
Disk and Network skew ratings are calculated as each server's standard deviation from the mean calculated from all segment hosts.
Low
Value is within 1 standard deviation from the mean. (Note: if the variance of the set is less than 3, skew is considered low regardless of deviation from mean.)
Moderate
Value is between 1 and 2 standard deviations from the mean.
Very High
Value is greater than 3 standard deviations from the mean.
