Defining Resource Groups and Resource Attributes
Command Center allows you to view resource groups that have been created in Greenplum Database, to add or delete resource groups, and to edit the resource group attributes Concurrency, CPU %, and Memory %.
To change values of the MEMORY_AUDITOR, CPUSET, MEMORY_SHARED_QUOTA, or MEMORY_SPILL_RATIO resource group attributes, use the ALTER RESOURCE GROUP SQL command.
Click EDIT to open the Resource Group editor.
To delete a resource group, select the resource group, and click the minus sign that appears at the right.
You cannot delete the
default_grouporadmin_groupresource groups. You cannot delete a resource group that is assigned to any Greenplum Database role.To add a resource group, click ADD RESOURCE GROUP and enter a name for the resource group in the Name column. Resource group names must be unique and are case-sensitive.
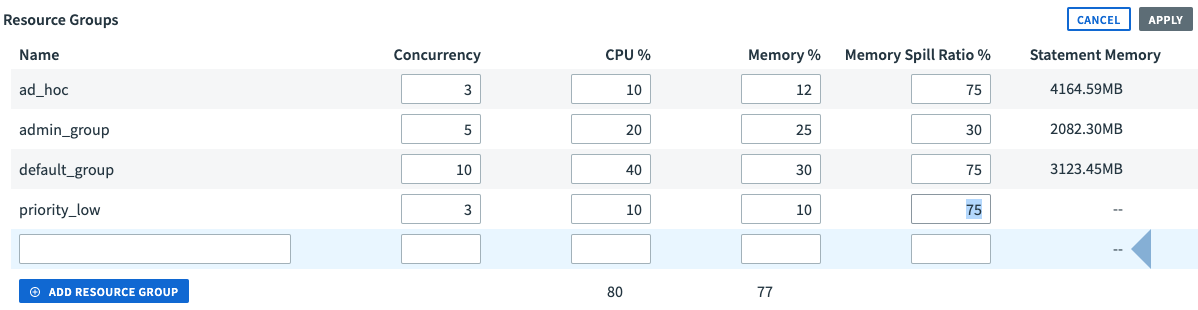
Adjust the values of the Concurrency, CPU %, and Memory % resource group attributes.
Concurrency
The maximum number of concurrent transactions, including active and idle transactions, that are permitted in the resource group. Concurrency sets theCONCURRENCYattribute of the resource group. The total of the Concurrency columns cannot exceed the value of the Greenplum Databasemax_connectionsmaster server configuration parameter. CPU %
The percentage of CPU resources available to this resource group. The percentage is the portion of the total CPU percentage allocated for all resource groups (reserved CPUs excluded), which is set with thegp_resource_group_cpu_limitserver configuration parameter. CPU % sets theCPU_RATE_LIMITattribute of the resource group. Memory %
The percentage of memory resources available to this resource group. The percentage is the portion of the total memory allocated for all resource groups, which is set with thegp_resource_group_memory_limitGreenplum Database configuration parameter. Changing the Memory % value sets theMEMORY_LIMITattribute of the resource group. Memory Spill Ratio % The memory usage threshold for memory-intensive transactions. When a transaction reaches this threshold, it spills to disk. Statement Memory The amount of memory allocated to a query. This column is recalculated as you adjust other resource group settings. If a query needs more memory, it is allocated from the resource group shared memory pool and the global shared memory pool, if available.
The totals of the CPU % and Memory % columns must not exceed 100%. You should not allow the total of the CPU % column to exceed 90%, because this could cause resource-intensive queries to consume nearly all CPU, starving other Greenplum Database processes. If the total of the Memory % column is less than 100%, the unreserved memory is part of the resource group shared global memory pool. See "Global Shared Memory" in Using Resource Groups in the Greenplum Database Administrator Guide for information about the global resource group shared memory pool.Click Apply to save your changes or click Cancel to abandon your changes.
Assigning Roles to Resource Groups
Every Greenplum Database role is assigned to a single resource group in the pg_roles system table. Transactions executed by a role are managed by its assigned resource group, unless you create an assignment rule to override the default.
You can view the current resource group assignments for all roles and change a role's resource group by adding it to a different resource group.
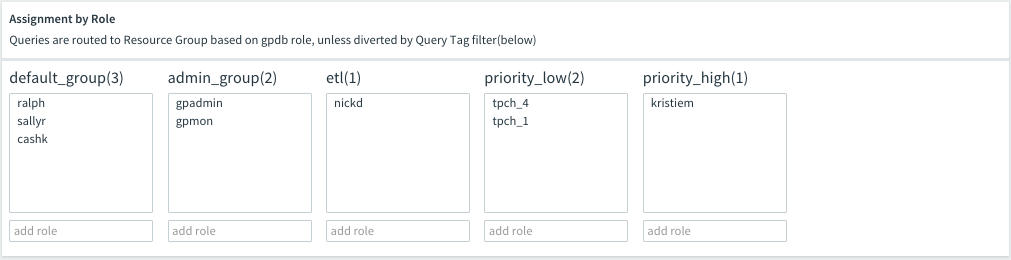
To move a role to a different resource group:
Enter all or part of the role name in the add role field beneath the new resource group.
Choose the role from the list that is displayed and press Enter.
The change is immediately applied to the Greenplum Database pg_roles system table.
Monitoring Resource Groups
You can determine whether your resource group settings are optimal by viewing resource utilization of resource groups, using the Command Center Resource Groups> Monitor view.
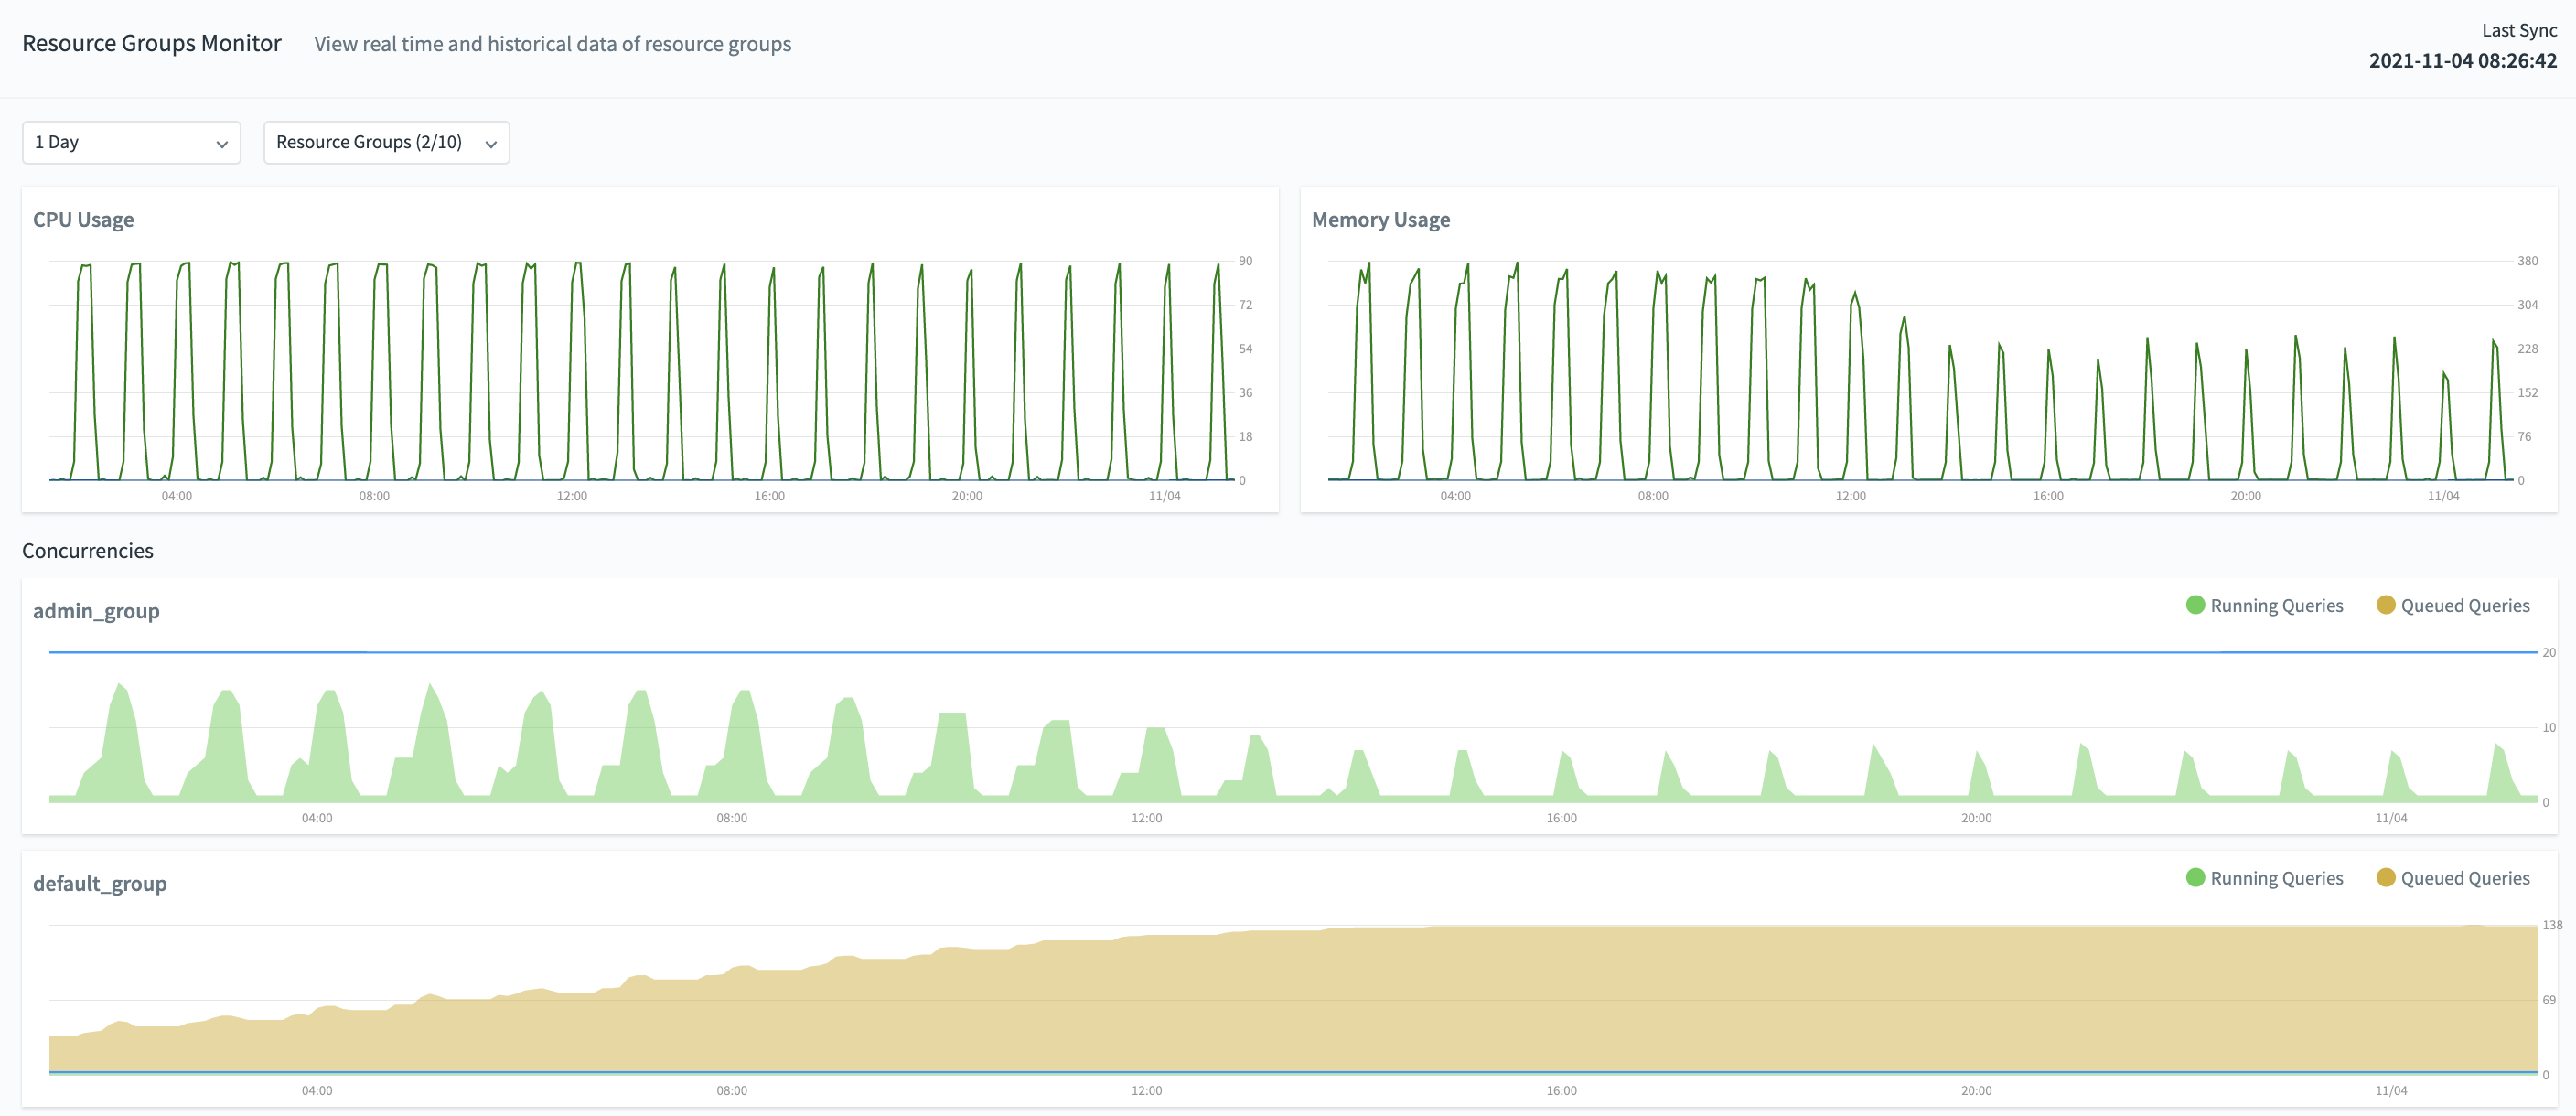
You may view the following information:
- CPU utilization of a single resource group, includes a time series of data showing:
- Average CPU usage percent per segment
- Maximum CPU usage percent on one of the segments in the cluster
- The CPU percent limit set for that resource group
- CPU utilization of a selection of resource groups, includes a time series of data showing:
- Average CPU usage percent per segment
- Memory utilization of a specific resource group, includes a time series of data showing:
- Average memory usage per segment
- Maximum memory usage on one of the segments in the cluster
- The memory limit set for that resource group
- Memory utilization of a selection of resource groups, includes a time series of data showing:
- Average memory usage per segment
- Concurrency status of selected resource groups, includes a time series of data showing:
- The number of running queries
- The number of queued queries
- The concurrency limit set for that resource group
Note: To perform these tasks, you must have a permission level of Operator Basic or above.
About Resource Group Selection
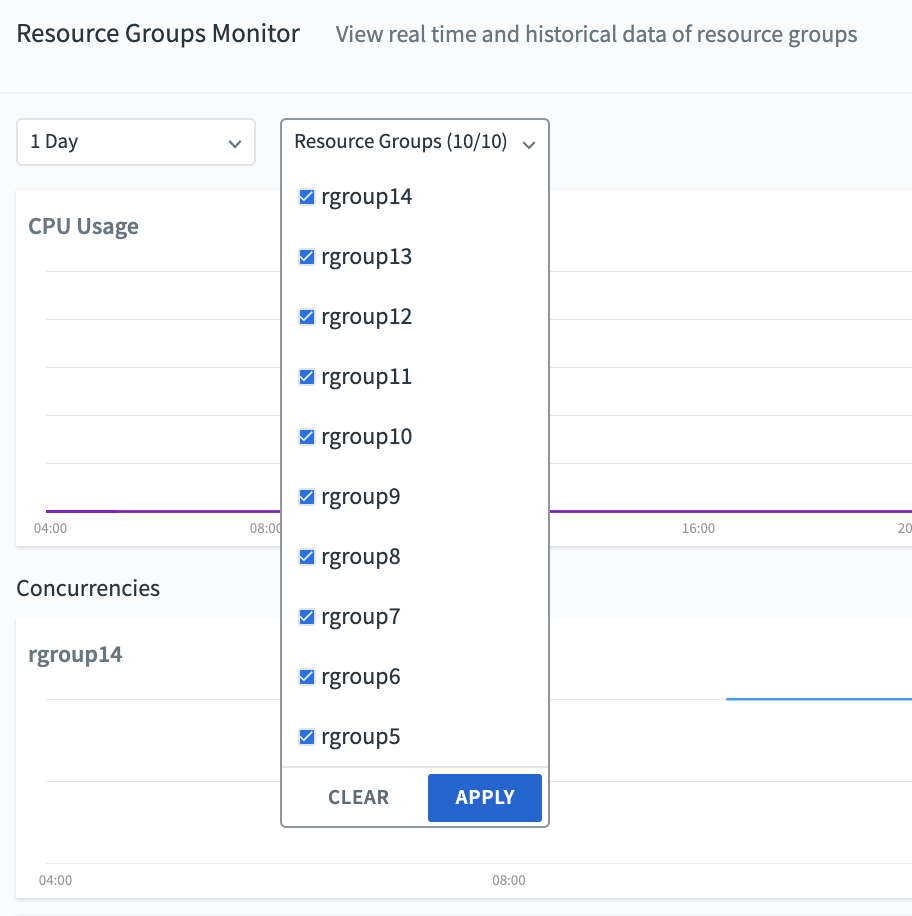
Using the dropdown menus on the Resource Groups Monitor page, you may select:
- the time interval for the data you are interested in viewing
- the resource groups whose data to display; you may select up to 10 resource groups at a time. Once you have selected resource groups whose information you want to view, you may click Apply to save the selection or Clear to clear it.