


VMware Greenplum Command Center is a management tool for the VMware VMware Greenplum Big Data Platform. This topic introduces key concepts about Greenplum Command Center and its components.
Greenplum Command Center Features
Greenplum Command Center monitors system performance metrics, analyzes cluster health, and enables database administrators to perform management tasks in a VMware Greenplum environment.
Greenplum Command Center provides a browser-native HTML5 graphical console for viewing VMware Greenplum system metrics and performing certain database administrative tasks. The Command Center application provides the following functionality:
- Interactive overview of realtime system metrics. Drill down to see details for individual cluster hosts and segments.
- Detailed realtime statistics for the cluster and by server.
- Query Monitor view lists queries executing, waiting to execute, and blocked by locks held by other queries.
- Query Detail view shows query metrics, query text, and the execution plan for the query.
- Workload Management view allows administrators to:
- Create and manage workloads to manage concurrency and allocate CPU and memory resources.
- Change default resource groups for VMware Greenplum roles.
- Create assignment rules to assign transactions to resource groups.
- Four permission levels allow users to view or cancel their own or others’ queries, and to view or manage administrative information.
- Cluster Metrics view shows synchronized charts of historical system metrics.
- History view lists completed queries and system metrics plotted over a selected time period.
- Permissions view to see or manage Command Center permission levels.
- Authentication view to see or edit the
pg_hba.confhost-based authentication configuration file. - Segment Status view with summaries and details by segment.
- Storage Usage view with summaries and details by segment data directory.
Note: Command Center versions 6.4/4.12.0 and later do not run on the Microsoft IE browser.
Greenplum Command Center Architecture
The following figure illustrates the Greenplum Command Center architecture.
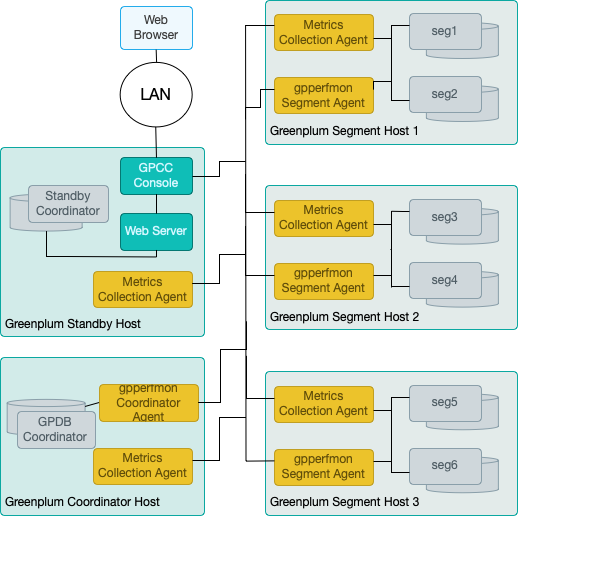
Greenplum Command Center Web Server and Web Application
The Greenplum Command Center web server and backend application can run on the coordinator or standby coordinator host—the coordinator host is recommended. The web server, gpccws, is a custom HTTP server designed for Command Center. The web application is an HTML5 and Go language application.
The Command Center web server authenticates users with the VMware Greenplum authentication system. Administrators can edit the VMware Greenplum host-based authentication file, pg_hba.conf, in the Command Center Console. Command Center can also be configured to authenticate users in a Kerberos environment.
Command Center defines four user authorization levels to manage users’ access to the Query Monitor, and to administrative information and operations. User authorization is managed in the Administrative area of the Command Center user interface.
Greenplum Command Center displays information derived from several sources:
- VMware Greenplum performance monitoring database (gpperfmon)
- Operating system process accounting
- VMware Greenplum system catalog tables
- Real-time query metrics collection extension
- Workload management extension
VMware Greenplum is instrumented to enable capturing performance metrics and tracking query execution. The performance monitoring database and the query metrics collection extension deploy agents—processes running on each host to collect metrics. The agents forward collected data to an agent on the VMware Greenplum coordinator. The real-time query metrics agents submit collected data directly to the Command Center rpc port. The agents also collect data from the host operating system so that query performance can be correlated with CPU and memory utilization and disk space can be monitored in Command Center.
VMware Greenplum Performance Monitoring Database
The gpperfmon performance monitoring database stores current and historical query status and system information collected from agents running on the coordinator and segment hosts. Greenplum Command Center uses gpperfmon for historical data only; it uses the real-time query metrics to monitor active and queued queries. VMware Greenplum sends UDP packets at various points during query execution. The gpsmon process on each segment host collects the data. Periodically, every 15 seconds by default, a gpmmon agent on the coordinator host signals the gpsmon process to forward the collected data. The agent on the coordinator host receives the data and adds it to the gpperfmon database.
The Command Center database consists of three sets of tables:
- now tables store data on current system metrics such as active queries
- history tables store data on historical metrics
- tail tables are for data in transition. Tail tables are for internal use only and should not be queried by users.
The now and tail data are stored as text files on the coordinator host file system, and the Command Center database accesses them via external tables. The history tables are regular database tables stored within the gpperfmon database.
You can run SQL queries on the data stored in the gpperfmon database. Greenplum Command Center runs queries on the database for information presented in the Command Center Console. The VMware Greenplum reference documentation contains references for the tables in the gpperfmon database.
Real-Time Query Metrics Collection
The data collected by real-time query metrics collection is more detailed and more current than statistics recorded in the gpperfmon database. Command Center users can observe queries as they execute and, with sufficient permissions, cancel problem queries to allow other queries to complete.
The VMware Greenplum query metrics extension and the metrics collection agent work together to collect real-time metrics and update the Command Center application.
VMware Greenplum calls the query metrics extension when a query is first submitted, when a query’s status changes, and when a node in the query execution plan initializes, starts, or finishes. The query metrics extension sends metrics to the metrics collection agent running on each segment host. The extension also collects information about the locks queries hold so that you can see which queries hold locks that block other queries. The agent posts the metrics to the Greenplum Command Center rpc port.
The metrics_collection extension is included with VMware VMware Greenplum. The extension is enabled by setting the gp_enable_query_metrics server configuration parameter to on and restarting the VMware Greenplum cluster. The metrics collection agent is installed on each host when you install Greenplum Command Center. The Command Center application monitors the agent and restarts it if needed.
Command Center Workload Management
Workloads set concurrency, memory, and CPU resource limits for database transactions they manage. A Greenplum Command Center workload corresponds to a VMware Greenplum resource group, but adds additional capabilities that are not available with resource groups.
Command Center allows administrators greater flexibility in assigning transactions to workloads. Every VMware Greenplum role is assigned to a single resource group and, by default, transactions are managed by the role’s resource group. With Command Center workload management, administrators can define criteria to assign transactions to workloads based on attributes other than the role submitting the transaction. Currently, assignment criteria can evaluate query tags and roles in combination with query tags.
A query tag is a key-value pair defined in the gpcc.query_tags parameter of a database session. The parameter has the format <tag1>=<value1>;<tag2>=<value2>, where tags and values are user-defined values. For example, if you want to run ETL operations in a workload named “etl”, you could define a tag named “xact-type” and set it to “etl”: xact-type=etl. The gpcc.query_tags parameter can be set as a connection parameter on VMware Greenplum clients that allow it, or with a SET command inside the session after the connection has been established, for example SET gpcc.query_tags='xact-type=etl'.
The gp_wlm extension in VMware VMware Greenplum provides support for Command Center workloads. Initially, VMware Greenplum uses resource queues to manage resources. Using Command Center workloads requires enabling resource groups in VMware Greenplum. Resource groups are based on the Linux control groups (cgroups) service, which must first be enabled in the operating system.
