


The Cluster Realtime Status view contains two categories of information: Host Metrics and Segment Status.
Host Metrics
The Host Metrics tab displays a table of the hosts in the cluster with statistics collected at the most recent quantum interval.
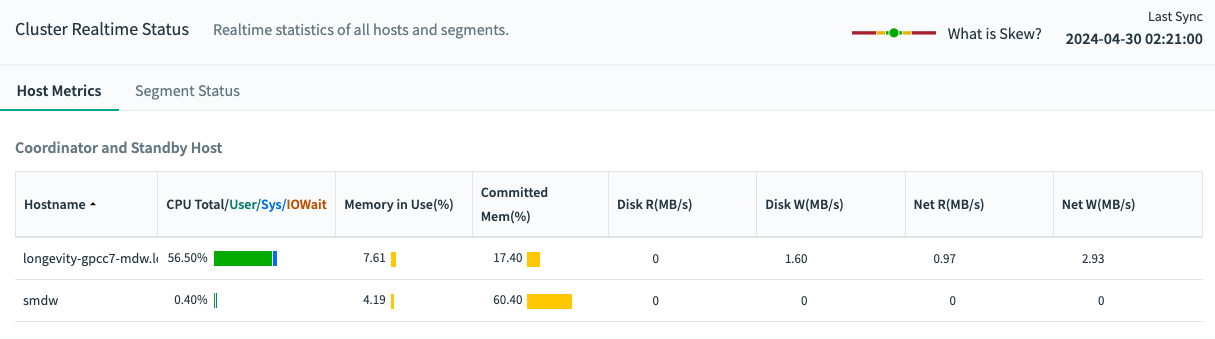
At the top right, Last Sync displays the time that the statistics were last updated.
Click a column header to sort the table by that column. Click again to toggle between ascending and descending sort. Coordinator and standby hosts are not included in the sort and are always displayed following the sorted list of segment hosts.
For each server, the following columns are displayed:
- Hostname
- The host name of the server.
- CPU Total/Sys/User/IOWait (%)
-
The CPU column shows the total percentage of CPU resources used for system processes, user processes, and IOWait. Hover over the table cell to show the percentages for each of these CPU modes, as well as the idle time.
When comparing Command Center CPU values with other Linux utilities such astop, there are slight differences.
To compare Command Center CPU user time withtop, adjust thetopCPU user time to be: CPU user time +nicetime. To compare CPU sys time, before Command Center 4.9/6.1, adjust thetoputility CPU sys time to be: sys time + iowait time. After 4.10/6.2, the values are similar, for example CPU sys = sys and CPU IOWait = iowait. - Memory In Use (%)
- The percentage of host memory in use is displayed next to a graph illustrating the memory in use and available. Hover over the table cell to see memory used and available in gigabytes.
Memory is calculated as follows:
Total = MemTotal
Free = MemFree + Buffers + Cached
Used = Total - Free
- Committed Mem (%)
- The percentage of Committed_AS memory in use. Hover over the table cell to see Committed_AS and CommitLimit values for each host, measured in gigabytes.
Committed_AS represents the current amount of memory allocated on the system. It encompasses all memory allocated by processes, regardless of whether it has been utilized by them yet or not.
-
Disk R (MB/s) - Displayed for coordinator and standby hosts
-
Disk read rate in megabytes per second.
-
Disk R (MB/s) Skew - Displayed for segment hosts
-
Disk read rate in megabytes per second is displayed next to a graph of calculated disk read skew. Hover over the table cell to see a Low/Medium/High rating for disk skew.
- Net R(MB/s) - Displayed for coordinator and standby hosts
-
Network read rate in megabytes per second.
-
Net R (MB/s) Skew - Displayed for segment hosts
-
Network read rate in megabytes per second is displayed next to a graph of calculated network read skew. Hover over the table cell to see a Low/Medium/High rating for network read skew.
-
Net W (MB/s) - Displayed for coordinator and standby hosts
-
Network write rate in megabytes per second.
-
Net W (MB/s) Skew - Displayed for segment hosts
- Network write rate in megabytes per second is displayed next to a graph of calculated network write skew. Hover over the table cell to see a Low/Medium/High rating for network write skew.
About Skew Calculations
Disk and Network skew values are calculated by subtracting the median skew value from the current skew value and dividing the result by the median skew value; this is calculated from all segment hosts.
No/Low
Skew value is within +/- 25% of the median.
Moderate
Skew value is between +/- 25% and +/- 50% of the median.
High
Skew value is over +/- 50% of the median..
Segment Status
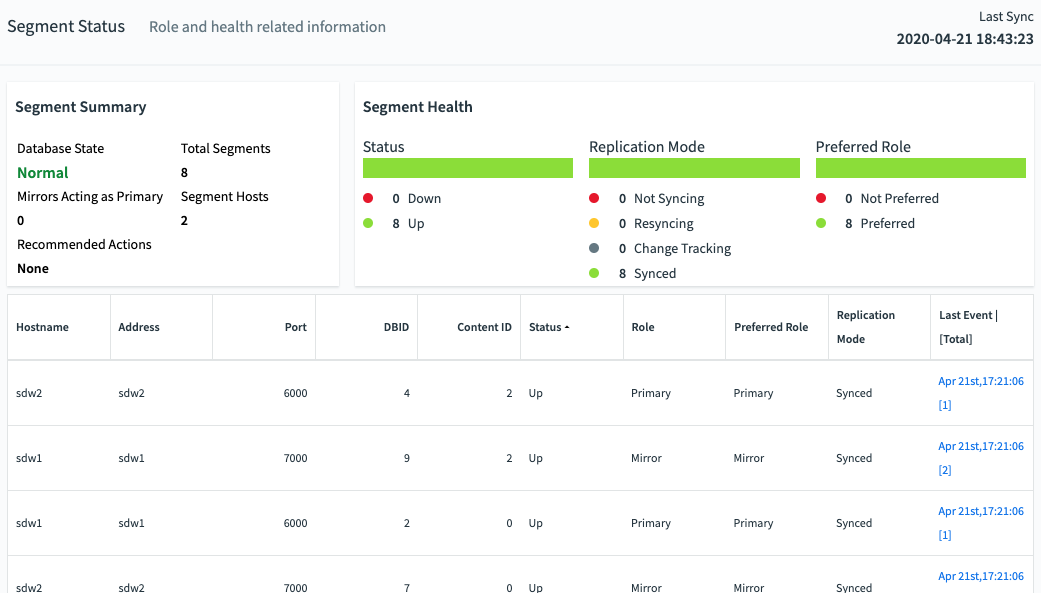
The Segment Status tab provides a health overview for the VMware Greenplum segments and details for each primary and mirror segment.
Segment Summary
VMware Greenplum is most efficient when all segments are operating in their preferred roles. The Segment Summary panel tells you the overall segment status and if any mirrors are acting as primaries.
The Segment Summary panel provides the following information:
Database State
The database state can be one of the following:
- Normal: The database is functioning with no major errors or performance issues.
- Segment(s) Down: The database is in change-tracking mode or resync mode. Overall performance and system reliability is greatly reduced. See the VMware Greenplum administration documentation for information about resolving this condition.
- Database Unreachable: The Greenplum Performance Monitor agent cannot connect to the database. The database is likely down. See the VMware Greenplum administration documentation for troubleshooting information.
- Unbalanced: Some segments are not running in their preferred roles. That is, primaries are running as mirrors and mirrors are running as primaries, resulting in unbalanced processing.
- Resyncing: The database is performing a recoverty or rebalance operation.
Mirrors Acting as Primary
The number of mirror segments acting as primary segments.
Recommended Actions
Suggests actions to perform to restore the cluster to balance. These include:
- Recover and Rebalance
- Rebalance
These actions are executed from the command line using the gprecoverseg Greenplum management utility. See gprecoverseg in the VMware Greenplum utilities documentation for more information.
Total Segments
The total number of primary and mirror segments in the Greenplum cluster.
Segment Hosts
The total number of segment hosts in the Greenplum cluster.
Segment Health
The Segment Health panel contains charts for VMware Greenplum segments’ status, replication mode, and preferred roles.
Status
Numbers of segments that are down and up.
Replication Mode
A chart that shows the number of segments in each of the possible replication modes.
-
Not Syncing: The primary segment and mirror segment are active and all changes to the primary segment have been copied to the mirror using a file block replication process.
-
Change Tracking: If a primary segment is unable to copy changes to its mirror segment using the file replication process, it logs the unsent changes locally so they can be replicated when the mirror again becomes available. This can happen if a mirror segment goes down or if a primary segment goes down and its mirror segment automatically assumes the primary role.
-
Resyncing: When a down segment is brought back up, administrators initiate a recovery process to return it to operation. The recovery process synchronizes the segment with the active primary and copies the changes missed while the segment was down.
-
Synced: Once all mirrors and their primaries are synchronized, the system state becomes synchronized.
Preferred Roles
The red portion of the Preferred Role chart shows the numbers of segments that not operating in their preferred primary or mirror roles. If the chart is not solid green, the performance of the Greenplum cluster is not optimal.
Primary and mirror segments are distributed evenly among the segment hosts to ensure that each host performs an equivalent share of the work and primary segments and their mirror segments reside on different segment hosts. When a primary segment goes down, its mirror on another host in the cluster automatically assumes the primary role, increasing the number of primary segments running on that host. This uneven distribution of the workload will affect query performance until the down segment is restored and the segments are returned to their original, preferred, roles.
Segment Table
The table at the bottom of the Segment Status page contains a detailed row for every primary and mirror segment in the Greenplum Cluster. The table has the following columns for each segment:
- Hostname
- The name of the segment host where the segment is running.
- Address
- The network interface on the segment host for the segment.
- Port
- The port number assigned to the segment.
- DBID
- The unique identifier for the segment instance.
- ContentID
- The content identifier for the segment, from 0 to the number of segments minus 1. A primary segment and its mirror have the same ContentID. The coordinator and standby coordinator, which have ContentID −1, are excluded from the table.
- Status
- “UP” if the segment is running, “DOWN” if the segment has failed or is unreachable.
- Role
- The segment’s current role, either “primary” or “mirror”.
- Preferred Role
- The segment’s intended role, either “primary” or “mirror”.
- Replication Mode
- The replication status for the segment. See Segment Health for possible values.
- Last Event|[Total]
- The date and time of last segment health-related activity. Click to display a list of recent events.
