


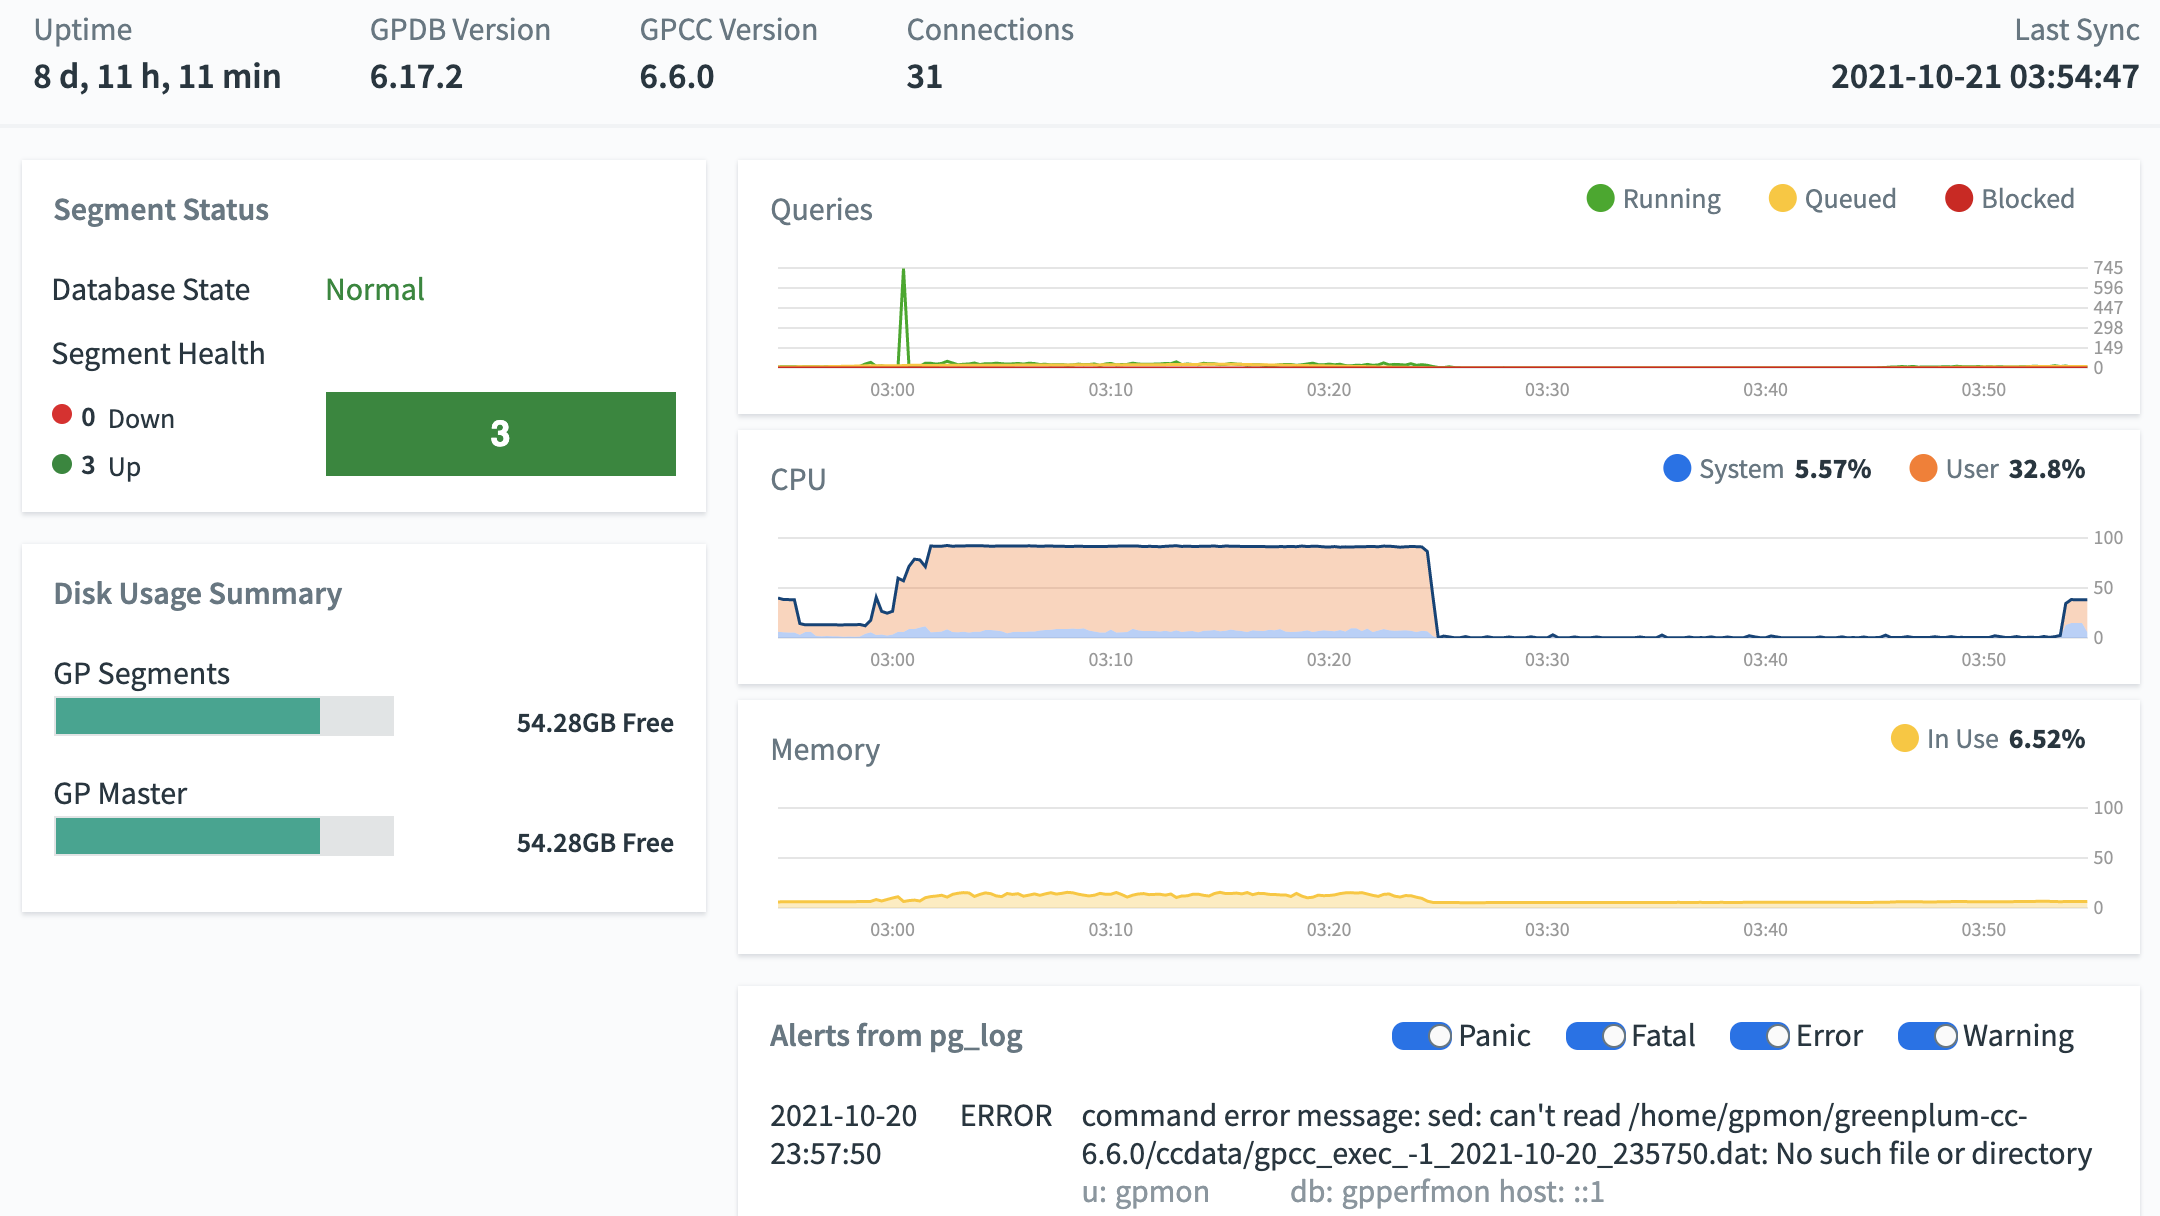
The Dashboard displays when you first sign in to VMware Greenplum Command Center. The Dashboard provides a quick view of the current system status, Segment Health, Queries, CPU, Memory, and Disk usage.
Clicking on a panel provides more detailed information about the metric. The Alerts panel shows the most recent messages from the VMware Greenplum log file. Some information is available only to Command Center users with Admin or Operator permission level.
System Information
The following system information is displayed at the top of the page.
Uptime
The elapsed time since the VMware Greenplum system was last started.
GPDB Version
The version of the VMware Greenplum software the monitored cluster is running.
GPCC Version
The version of the Greenplum Command Center software.
Connections
The number of active VMware Greenplum sessions (client connections).
Server
The display name for this Greenplum Command Center.
Last Sync
Date and time the data was last synchronized. The Command Center user interface updates views with live data every 15 seconds.
Segment Health
The Segment Health section of the Dashboard provides a quick overview of the status of the database system and segments this Command Center monitors.
Database State
Database State is the current state of the VMware Greenplum system. Following are some possible database states:
- Normal: The database is functioning with no major errors or performance issues.
- Segment(s) Down: The database is in change-tracking mode or resync mode. Overall performance and system reliability is greatly reduced. See the VMware Greenplum administration documentation for information about resolving this condition.
- Standby Down: The coordinator standby instance cannot be reached.
- Standby Not Syncing: The coordinator standby instance is not synchronizing with the coordinator instance.
- Database Unreachable: The Greenplum Performance Monitor agent cannot connect to the database. The database is likely down. See the VMware Greenplum administration documentation for troubleshooting information.
- Unbalanced: Some segments are not running in their preferred roles. That is, primaries are running as mirrors and mirrors are running as primaries, resulting in unbalanced processing.
- Resyncing: The database is performing a recovery or rebalance operation.
Note: An error message or state other than the above may be an indication of a network connectivity problem, or of another undetected problem in the VMware Greenplum system. Run the gpstate utility on the coordinator host to determine if there are issues to troubleshoot in the VMware Greenplum system.
Segment Status
The bar graph in the Segment Status tab in the Cluster Realtime Status view shows the up or down status of all database segments in your VMware Greenplum system. A color indicator and associated number indicate the number of database segments that are currently in that particular state. Segments can have the following states:
- Up (Green)
- Down (Red)
Disk Usage Summary
This chart displays total disk usage and disk available for the Greenplum coordinator host and segment hosts at the last synchronization. Hover over the chart to see the amount of disk used, free, and total.
Queries
This graph displays a summary view of active and queued queries for the last 60 minutes. Click on the colored dot next to the Running or Queued label to toggle the line on or off. At least one line must be visible at all times. Hover over the graph to display the number of queries for each visible line at that point in time.
CPU
This graph displays average CPU usage across the entire cluster, for the last 60 minutes. The graph displays separate lines for system processes and user processes. The user CPU usage includes the VMware Greenplum coordinator, standby, and segment processes. Click on the colored dot next to the System or User label to toggle that line on or off. At least one line must be visible at all times.
Hovering the cursor over a line in the graph displays a small window with the percentage of CPU used at that point in time for the visible lines and the total if both the system and user lines are visible.
Memory
This graph displays the average percent of memory used across the entire cluster over the last 60 minutes. Hover over the line to display the percent of memory used at that point in time.
Alerts
Admin and Operator permission levels only
The Alerts panel displays recent messages from the VMware Greenplum pg_log log file. The panel is updated at each synchronization. Filter the messages by severity level using the controls at the top right of the panel.
