


Use the Recommendations page to find tables that require maintenance. Command Center users with Admin permission can make changes to this page.
Scheduling Scans
Schedule a period of time during which Command Center scans databases for tables that need to be vacuumed, analyzed, or redistributed.
Command Center scans tables of type heap, append-optimized (AO), and append-optimized/column-oriented (AO/CO) that have size greater than zero. Views and external tables are not scanned.
Tables that have been updated recently or have never been scanned are scanned first.
It is best to schedule the scan during a down-time or a period of low activity to minimize the effect of the scan on database performance.
You can set the date and time the scan begins and the duration of the scan. Check Repeat to set the scan to repeat daily, or weekly on selected days of the week.
Command Center starts scanning automatically at the scheduled time. A message is displayed on every Command Center page while the scan is in progress. It may not be possible to scan all tables in the scheduled period, but when the next scan begins, Command Center resumes scanning where the previous scan left off, until all tables have been scanned. Then the scan starts over.
The recommendation tables always list results from the most recent scan.
Click Repeat Settings to view a history of scans or to update the scan schedule.
Choose a database and schema and click SELECT to view recommendations. Recommendations are reported in four reports:
Bloat
Bloat is a measure of the amount of unused space and space occupied by dead tuples in a table.
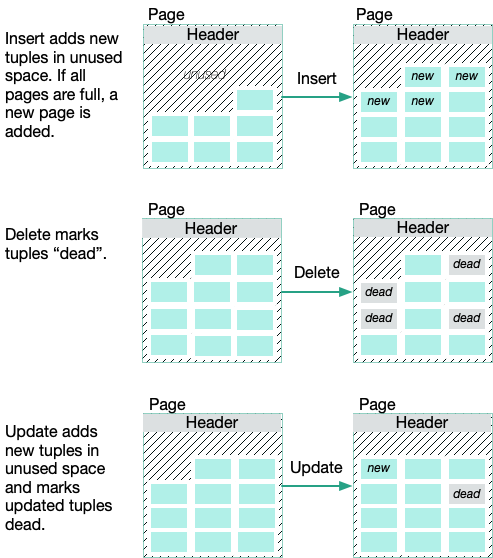
VMware Greenplum uses PostgreSQL multi-version concurrency control (MVCC) to manage concurrent transactions. Table storage is organized into fixed size pages containing a header, an array of item pointers, unused space, and tuples (rows).
- Inserting a tuple into a table adds a new tuple and reduces the amount of unused space on the page. Tuples are allocated from the end of the unused space.
- Deleting tuples marks them dead, but does not remove them from the page.
- Updating a tuple inserts a new live tuple and marks the original tuple dead.
- New pages are added to the table when there is insufficient unused space to add new tuples.
Over time, the dead tuples accumulate, consuming a greater proportion of the table. New pages are added when unused space is depleted, increasing the file size of the table. Scanning a table with a large amount of bloat requires additional I/O, and has a detrimental effect on query performance.
The VACUUM command removes the dead tuples, increasing the amount of unused space available for new live tuples. VACUUM only reduces the size of the table on disk if the unused space is at the end of the table. Command Center by default recommends vacuuming a table when dead tuples occupy more than 10% of the space. You can specify a different threshold by setting the bloat_threshold parameter in the gpmetrics configuration file. See the gpmetrics Configuration File Reference for details.
The VACUUM FULL command removes dead tuples and compacts the table to the mininum number of pages by packing live tuples on pages. By default, Command Center recommends VACUUM FULL for heap tables when dead tuples and unused space occupy greater than 50% of the space. You can specify a different threshold for the VACUUM FULL recommendation by setting the bloat_vacuum_full_threshold parameter in the gpmetrics configuration file. See the gpmetrics Configuration File Reference for details.
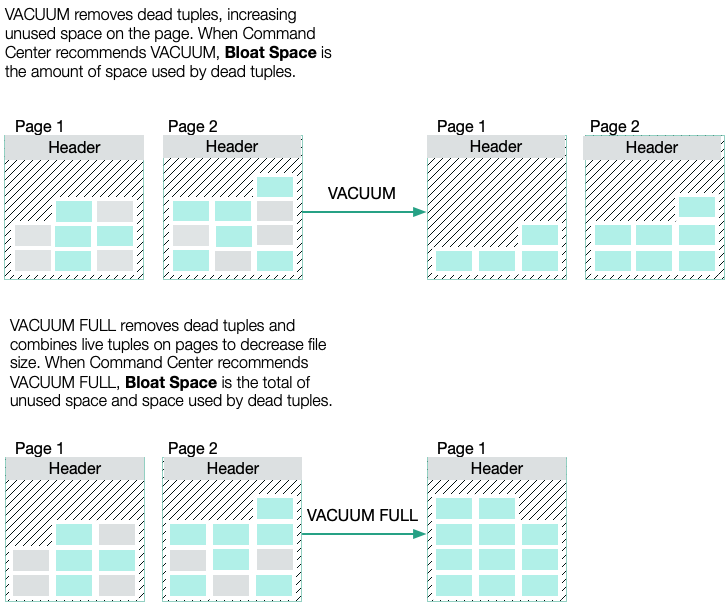
For append-optimized (AO) and append-optimized/column-oriented (AO/CO) tables, Command Center recommends VACUUM. Vacuuming AO and AO/CO tables has the same effect as VACUUM FULL for heap tables.
VACUUM FULL is an expensive operation, requiring an ACCESS EXCLUSIVE lock and additional disk space, and it should be avoided, especially for very large tables. Running VACUUM frequently can prevent the need to run VACUUM FULL.
For more information about VACUUM and VACUUM FULL, see VACUUM in the VMware Greenplum SQL Commands Reference.
The Bloat Rank table lists tables by the estimated amount of bloat space, from greatest to least.
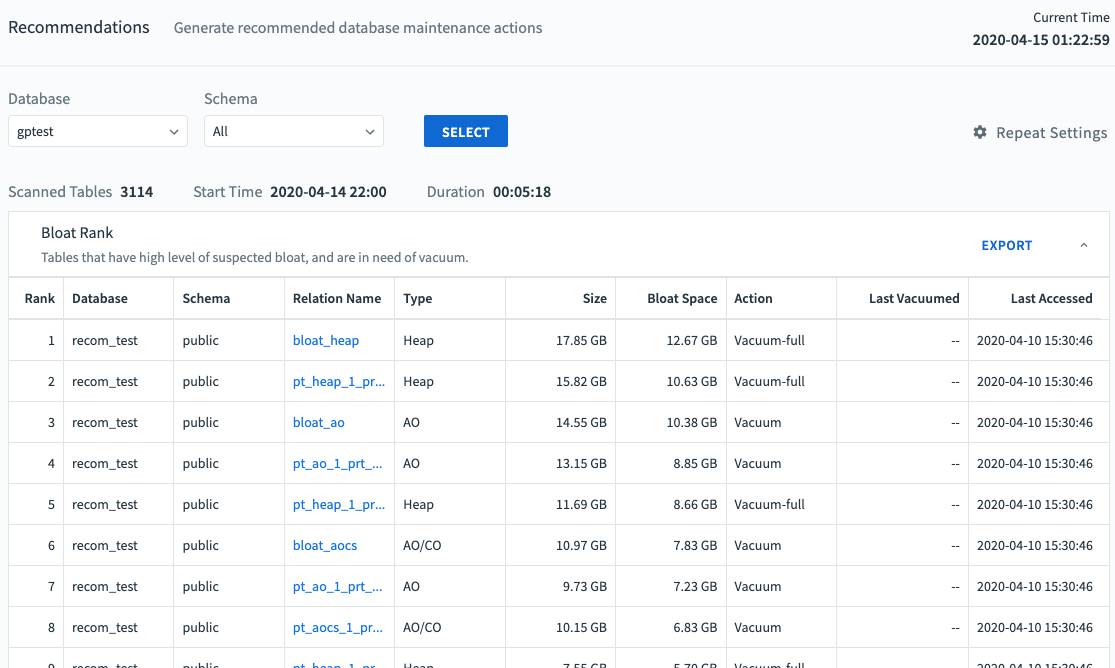
The Bloat table has these columns:
Rank
Tables in the list are ranked by the estimated amount of bloat
Database
Name of the database containing the table
Schema
Name of the schema to which the table belongs
Relation Name
Name of the table
Type
Storage type for the table, for example heap or AO (append-optimized)
Size
Total size of the table on all segments
Bloat Space
The amount of space that can be freed with the recommended action. If the recommended action is VACUUM, Bloat Space is the amount of space occupied by dead rows. If VACUUM FULL is recommended, Bloat Space is the total unused space and space occupied by dead rows.
Action
Running VACUUM FULL decreases the size of the table and is recommended only when the table size would be reduced by at least 50%. Running VACUUM removes only dead tuples, increasing unused space.
Last Vacuumed
Time the table was last vacuumed. This is the end of the Command Center sampling period during which the vacuum completed.
Last Accessed
Time the table was last updated (DELETE, INSERT, or UPDATE operation).
Accuracy
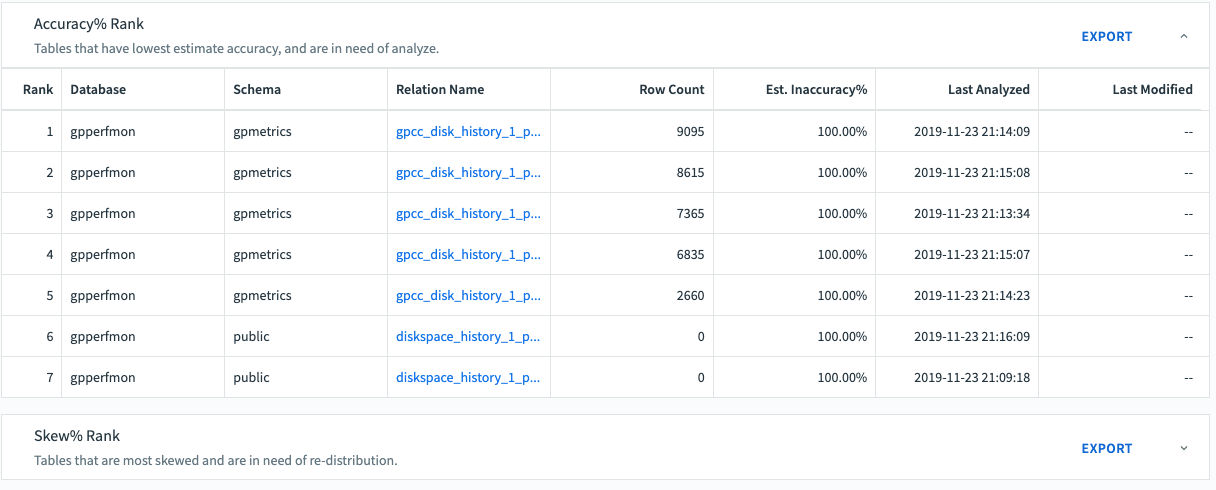
The Accuracy% Rank table lists tables ranked by Est.Inaccuracy. A higher Est.Inaccuracy is an indication that you should run ANALYZE on the table to update the table statistics. When statistics are inaccurate, the optimizer can generate an inefficient query plan.
The Est.Inaccuracy metric is calculated from query history by comparing the query plan estimate of rows and the actual number of rows returned by table scans. The calculation includes scan operations (query plan scan nodes) for queries that completed in the last 30 days and that started after the scanned table was last analyzed. The formula for inaccuracy is:
inaccuracy = (MAX(plan_rows, actual_rows) - MIN(plan_rows, actual_rows)) / MAX(plan_rows, actual_rows)
Scans without conditions (WHERE clauses) are considered more predictive of row count accuracy, so if the query history has both scans without conditions and scans with conditions, then scans without conditions are weighted more heavily.
By default, the Accuracy% report includes tables with a calculated inaccuracy of at least 10%. You can specify a different threshold by setting the accuracy_threshold parameter in the gpmetrics configuration file. See the gpmetrics Configuration File Reference for details.
The Accuracy% table has these columns:
Rank
Tables in the list are ranked by Est.Accuracy%, from least to greatest.
Database
Name of the database containing the table
Schema
Name of the schema to which the table belongs
Relation Name
Name of the table
Row Count
Number of rows in the table
Est.Accuracy%
Estimate of statistics accuracy from 0.0 to 1.0
Last Analyzed
Time the table was last analyzed. This is the end of the Command Center sampling period during which the analyze operation was completed.
Last Modified
The most recent timestamp among last_ins, last_del, and last_upd.
Skew
Skew is a measure of how evenly table rows are distributed to VMware Greenplum segments. When some tables are distributed unevenly, queries can take longer to complete.
Skew% is a value between between 0% and 100%, inclusive. The higher the value, the more skew is present in the distribution of the table. Given a table T distributed among n segments, S_1_ is the number of tuples on segment 1 and S_n_ is the number of tuples on segment n:
Avg = (S1 + S2 + ... Sn) / n
Max = MAX(S1, S2, ... Sn)
Skew% = (1 - Avg / Max) / (1 - 1/n) * 100%
A high Skew% for a table is usually caused by a poor choice of distribution key. The distribution key should be a column (or columns) with high cardinality, such as a unique ID. Columns that have a limited number of possible values make poor distribution keys and will result in skew. You can distribute the table RANDOMLY to ensure an even distribution if there is no suitable column.
If Commmand Center recommends redistributing a table, use the ALTER TABLE command:
ALTER TABLE <table-name> SET DISTRIBUTED BY (<column>, ...);
The table will be redistributed using the new distribution key.
Use this command to change the distribution policy for a table to RANDOMLY:
ALTER TABLE <table-name> SET DISTRIBUTED RANDOMLY;
ALTER TABLE <table-name> SET WITH (REORGANIZE=TRUE);
The second ALTER TABLE command is needed to redistribute the table. Without it, only newly added rows will be distributed randomly.
By default, the Skew% report includes tables with a calculated skew of at least 10%. You can specify a different skew threshold by setting the skew_threshold parameter in the gpmetrics configuration file.
A table with a small number of rows can have a high Skew value because there are insufficient rows to achieve an even distribution. Command Center excludes such tables from the Skew% report by filtering for tables that have at least 128 * NSeg rows, where NSeg is the number of segments in the Greenplum system. You can change this default by setting the skew_tuple_per_segment value in the gpmetrics configuration file.
See the gpmetrics Configuration File Reference for more information about setting the skew_threshold and skew_tuple_per_segment parameters.
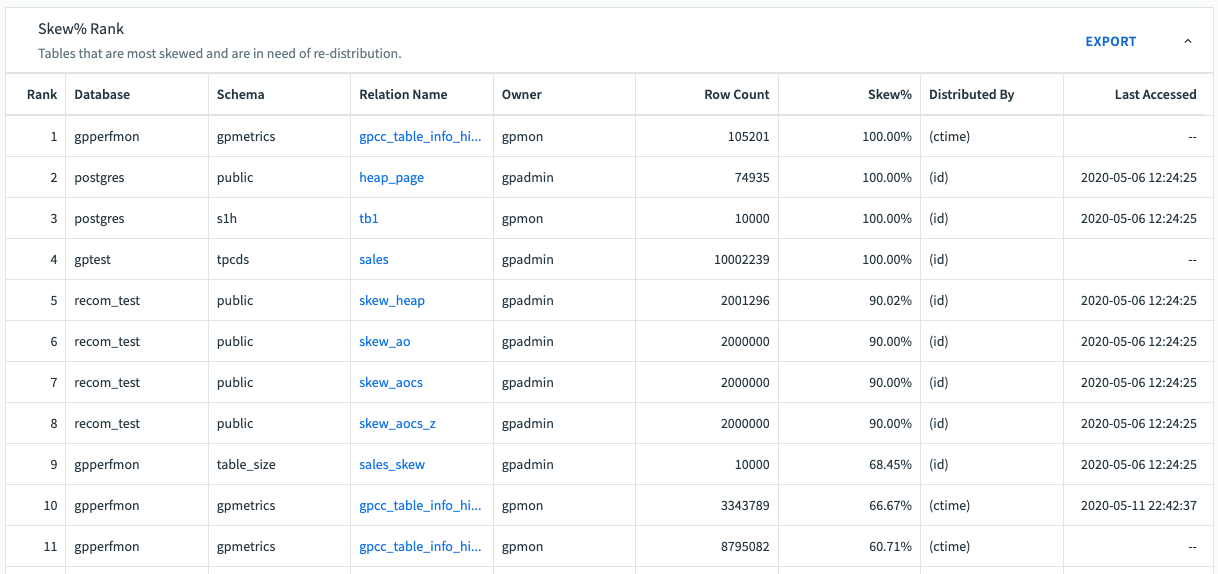
The Skew% table has these columns:
Rank
Tables in the list are ranked by Skew%, from greatest to least
Database
Name of the database containing the table.
Schema
Name of the schema to which the table belongs
Relation Name
Name of the table
Row Count
Number of rows in the table
Skew%
Amount of skew, between 0% and 100%. A lower percentage is best for VMware Greenplum query performance.
Distributed By
The current distribution key for the table.
Age
The Age Rank table lists tables ranked by age. A higher Age is an indication that you should run VACUUM FREEZE on the table in order to prevent database failures caused by transaction ID wraparound.
As tables age, the risk of transaction ID (XID) wraparound – also known as XID exhaustion – increases, which can result in catastrophic data loss. You can prevent this by running VACUUM FREEZE on older tables. VACUUM FREEZE marks the table’s rows as frozen in order to reduce the number of past transactions, thereby diminishing the risk of issues caused by XID wraparound.
You can control how old a table must be for Command Center to issue a VACUUM FREEZE recommendation in the Age Rank report by configuring the age_ratio property in the gpcc.conf file. For more information, see the gpmetrics Configuration File Reference.
Once the user has run VACUUM FREEZE on a table, that table’s row in the Age Rank table is highlighted in grey.
To export the Age Rank list to a text file, click Export.
The Age Rank table lists table age, from oldest to youngest.
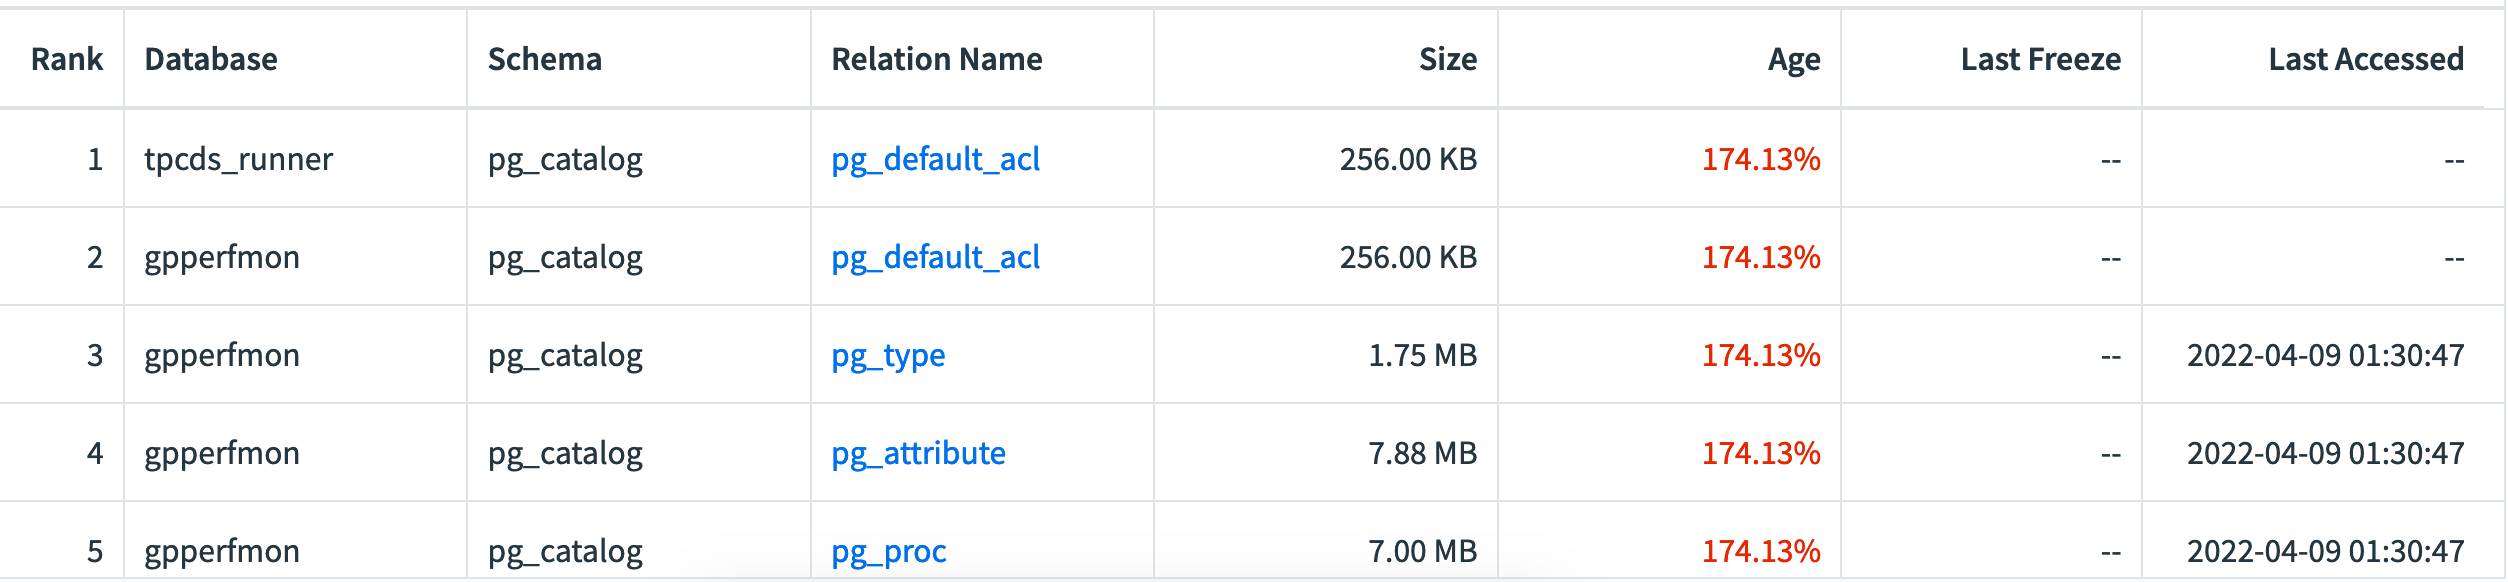
The Age table has these columns:
Rank
Tables in the list are ranked by Age, from oldest to youngest
Database
Name of the database containing the table
Schema
Name of the schema to which the table belongs
Relation Name
Name of the table
Owner
The table owner
Row Count
Number of rows in the table
Size
Size of the table
Age
Age of the table, expressed as a percent of (2 billion - xid_stop_limit - xid_warn_limit). For example, if the table’s age is reported as 50%, it means the table is about halfway to reaching the point where data loss could occur. When a table’s age reaches (2 billion - xid_stop_limit - xid_warn_limit), it means the transaction ID has reached the value specified in xid_warn_limit. When this happens, users will see the warning message: “WARNING: database “<database_name>” must be vacuumed within <number_of_transactions> transactions”.
To read more about the role of the xid_stop_limit and xid_warn_limit GUCs in preventing transaction ID wraparound, see the Transaction ID Wraparound topic.
Last VACUUM FREEZE
Date of the last VACUUM FREEZE performed on the table
Last Accessed
The date the table was last accessed
Index Bloat
Index bloat is a measure of the amount of reusable space in an index. Index bloat increases the amount of time required to perform an index lookup, thereby compromising performance.
Command Center by default recommends reindexing a table when the amount of resusable space in an index is 70% or more of the total index space. You can specify a different threshold by setting the index_bloat_threshold parameter in the gpmetrics configuration file. See the gpmetrics Configuration File Reference for details.
Command Center only displays tables that have an Index Bloat Rate larger than the value of the index_bloat_threshold parameter. In addition, Commmand Center only displays the index bloat rank for catalog tables.
The recommendations scan only reports on catalog tables. To retrieve recommendations for reindexing user tables, run the gpcc_reindex_check user-defined function. For more information, see its discussion in the gpmetrics Schema Reference.
The Index Bloat table has these columns:
Rank
Tables in the list are ranked by the estimated amount of bloat in their index
Database
Name of the database containing the table
Schema
Name of the schema to which the table belongs
Relation Name
Name of the table
Index Name
Name of the index
Index Size
Size of the index
Index Bloat Space
Amount of space that can be freed with the REINDEX action
Bloat%
Percentage of index bloat
Last Re-Indexed
Time the table was last reindexed
Last Scan
Time the recommendations scan last ran
