


The Storage Usage page shows current historical disk usage for Greenplum coordinator and segment hosts.
Disk Usage Summary
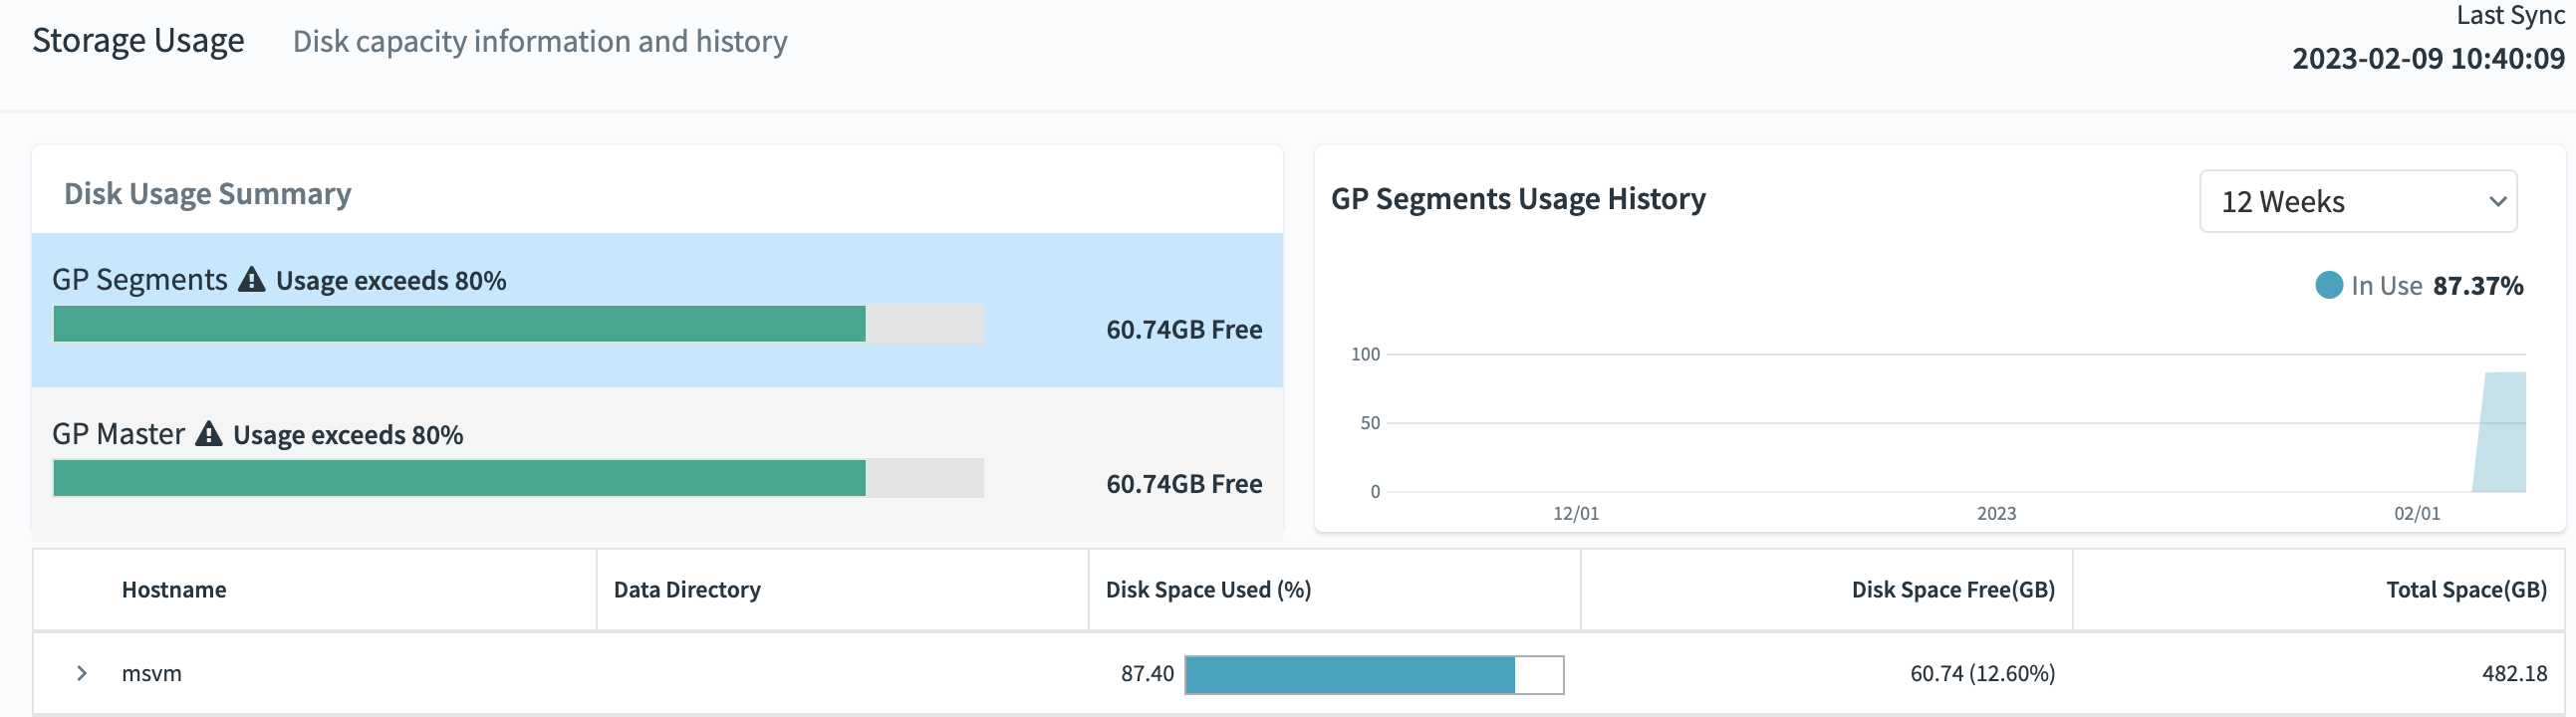
You can see current disk space in use, space free, and total space in the Disk Usage Summary panel. Disk space metrics for the segment hosts (GP Segments) and the coordinator (GP Coordinators) are shown in separate bar charts.
The GP Segments bar chart shows combined disk space for all segments.
The GP Coordinators bar chart shows combined disk space for coordinator and standby coordinator.
Click either of the summary charts to see details by host: space used, free, and total in gigabytes and as a percentage of the total.
Click a host name to display a list of directories on the host file system where partitions containing one or more VMware Greenplum data directories are mounted. Hover over the directory name to see a list of the Greenplum data directories the partition contains.
GP Segments Usage History
The GP Segments Usage History panel presents a chart of percentage of disk space in use for the time period set by the control in the panel header.
Hover over the chart to see the percentage disk in use by all VMware Greenplum segments at any given point in time.
GP Coordinators Usage History
The GP Coordinators Usage History panel presents a chart of percentage of disk space in use by the coordinator and standby coordinators for the time period set by the control in the panel header.
Hover over the chart to see the percentage disk in use at any given point in time.
