


The system Dashboard provides the access to status and services, configuration settings, and system-level administration tasks.
The Dashboard is the first screen that appears after you log in to the system Appliance Management interface port (:9443).
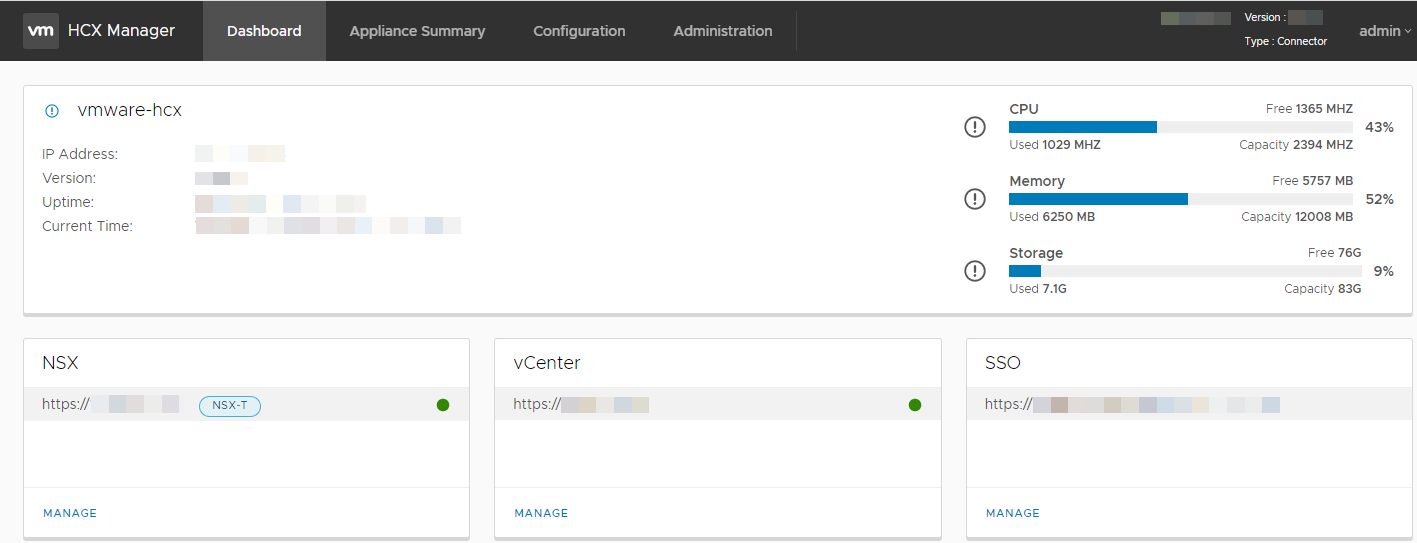
The Dashboard provides the access to various system management settings through a set of tabs at the top of the display.
For installations where the vCenter Servers are in linked-mode, the Dashboard includes information from all vCenter Servers registered to a system.
Tab Entry |
Description |
|---|---|
Dashboard |
Displays the appliance status as a set of summary panels:
The panels that are visible in the display depend on the installation type. To change the configuration settings for a panel, click Manage. The system redirects you to the Configuration tab, where you can update the settings. |
Appliance Summary |
Displays the status of services running on the system:
Options are provided to stop and restart services. The list of services in the display varies based on the installation type. |
Configuration |
Displays the list of service configuration settings.
To display the current settings, click an item in the list. To modify the current settings, click Edit. |
Administration |
Displays the list of system-level configuration settings.
To display or edit the settings, click an item. |
