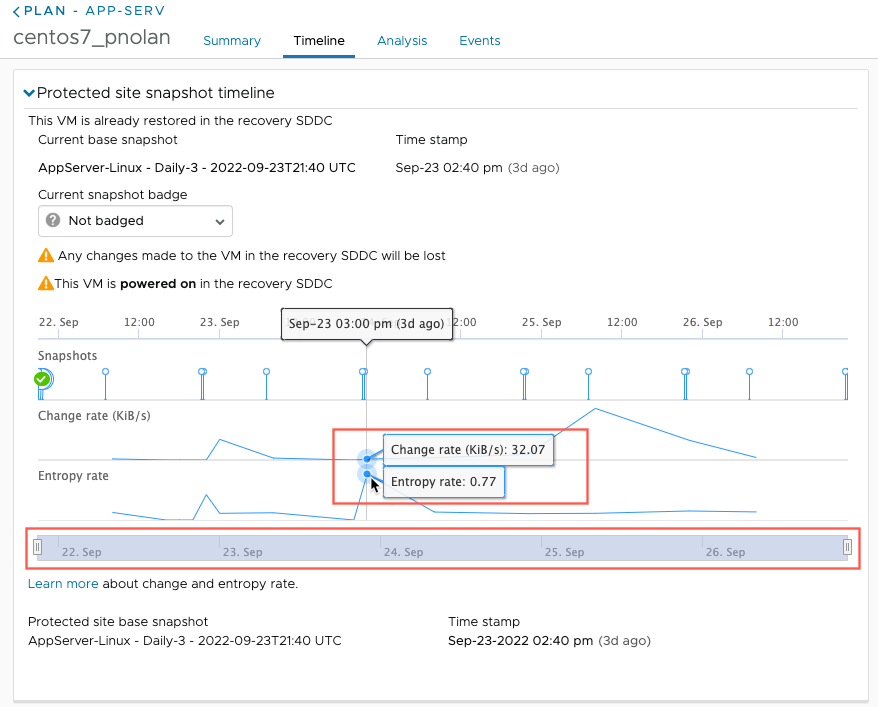
When validating VMs in ransomware recovery, you select historical snapshots of each VM to analyze such metrics as change rate, entropy rate, and other advanced metrics across all snapshots.
The snapshot timeline appears when you first start VMs in validation and select a snapshot from the Timeline tab in validation, and when you try a different snapshot during validation.

Change Rate and Entropy Rate
- Change rate. The amount of bytes changed / (time difference between the current snapshot and the previous snapshot). A high value indicates that too many changes happened during this time. During a ransomware attack, many files are encrypted, so this value is higher. So, if you have a snapshot with a high entropy and high change rate, it might indicate a ransomware attack.
For example, if the change rate for a VM in a snapshot is typically approximately 100 KB/s, then suddenly changes to 500 KB/s, the snapshot could then be considered suspicious.
Note: For the first snapshot of a VM after a product upgrade, change rate is not reported. - Entropy rate. 1/compression ratio. Entropy rate is a number between 0 and 1, and the closer it is to 1, the higher the likelihood that the snapshot is encrypted. Sudden jumps in entropy can indicate possible encryption.
For example, if the entropy rate (1/compression ratio) for a VM is .5 or .6, and then it jumps to almost 1, then the snapshot is suspicious.
VMware Live Cyber Recovery uses the inverse of the data compression ratio to approximate an entropy rate. The entropy rate of the data is 1 when the data is incompressible: such incompressible data usually means the data is either encrypted or already compressed. The entropy rate of data is smaller because the data is more compressible.
When VMware Live Cyber Recovery detects an unusually high change rate and entropy rate, it can indicate unusual activity, such as ransomware attack encrypting the data. The snapshot before the onset of such activity might be a snapshot containing unencrypted data.
For example, a common type of ransomware attack involves encrypting the user files and removing other files from the guest VM. During a malicious encryption operation, the incremental snapshot includes the encrypted data in addition to regular modified VM data.
Because the VMware Live Cyber Recovery snapshot is always incremental, only the modified or new data transfers to the cloud backup. When compared with normal snapshot where no ransomware attack is occurring, a problem snapshot has more data transferred, and out of all transferred data, it has a higher percentage of data being encrypted, thus showing a high entropy rate.
Advanced Metrics
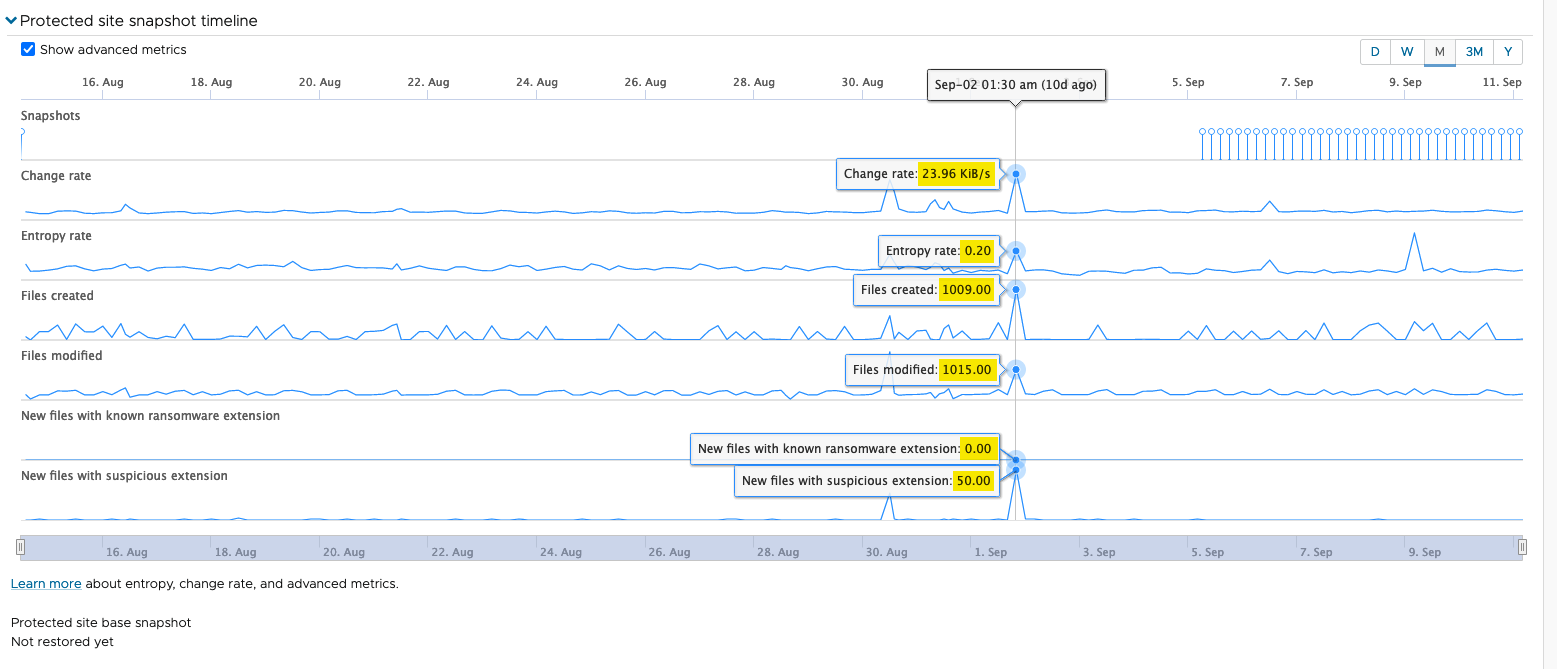
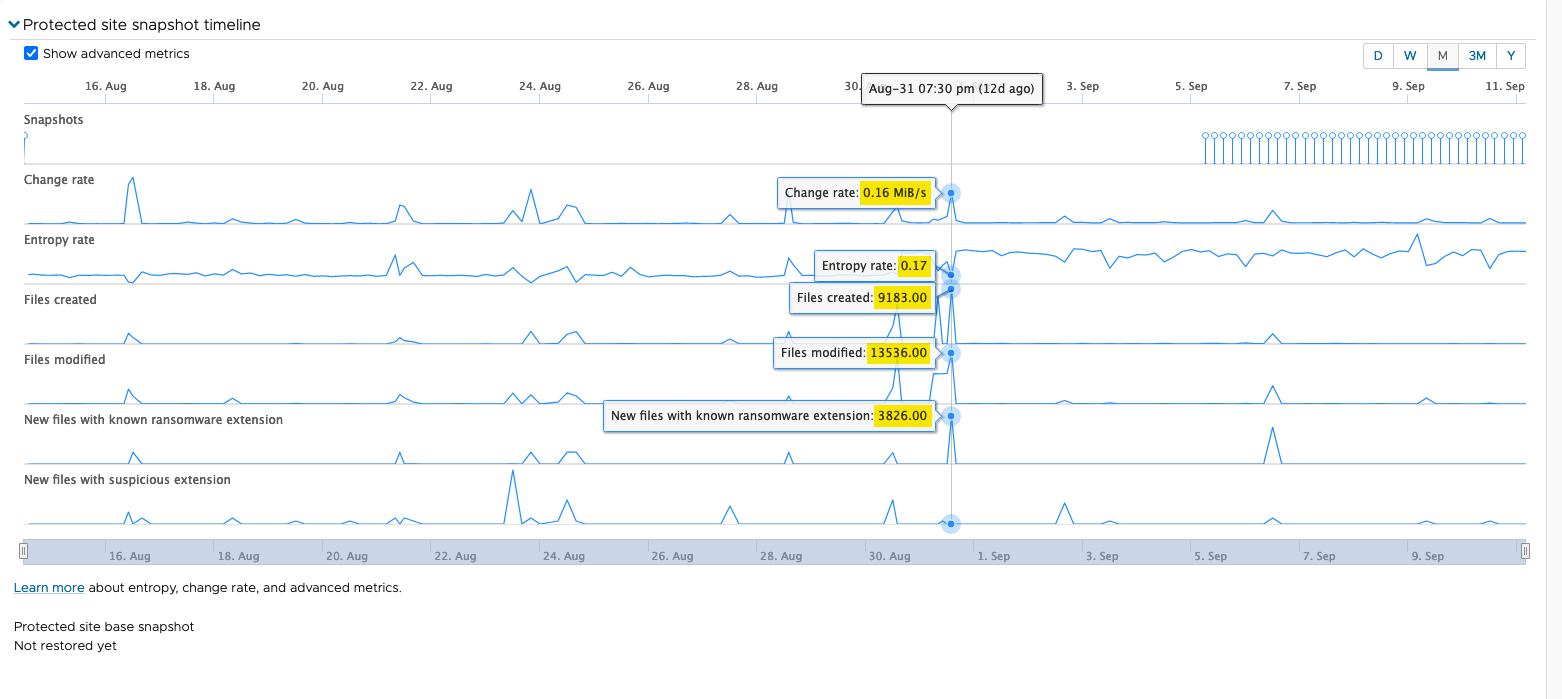
- Files created. During a ransomware attack, attackers often add a ransom note in a text file in each directory, which can spike the number of files in a snapshot. Some ransomware attackers don’t change files but rather they create new encrypted files, and then delete the original user file when finished.
- Files modifed. If there are a large number of files that have been modified in the snapshot, based on deltas in the snapshots over time, this could be in indication of the ransomware attacker changing filenames to obscure them and encrypt them. Every time the attacker encrypts a file it is counted as modified file. Filename changes and even and even file deletions are counted as modified file. (VMware Live Cyber Recovery uses windows NTFS “modified time” to determine if a file is modified or not.)
- New files with known ransomware extension. Many ransomware hackers use known file extensions when they encrypt data and lock during an attack. If the graph shows a spike in this metric, it is an indication of potential ransomware attack.
- New files with suspicious extension. In some cases, hackers will use random file extensions on encrypted data, such as a series of random numbers, which is suspicious and might indicate a ransomware attack.
For example, this timeline shows a snapshot of a VM that has not been compromised by a ransomware attack (metrics highlighted in yellow):

If this VM encounters a ransomware attack, most of the metrics will increase, with a higher change rate, entropy rate, number of files created and modified, and importantly, a large increase in new files with known ransomware extensions:

Expired Snapshots on the Timeline
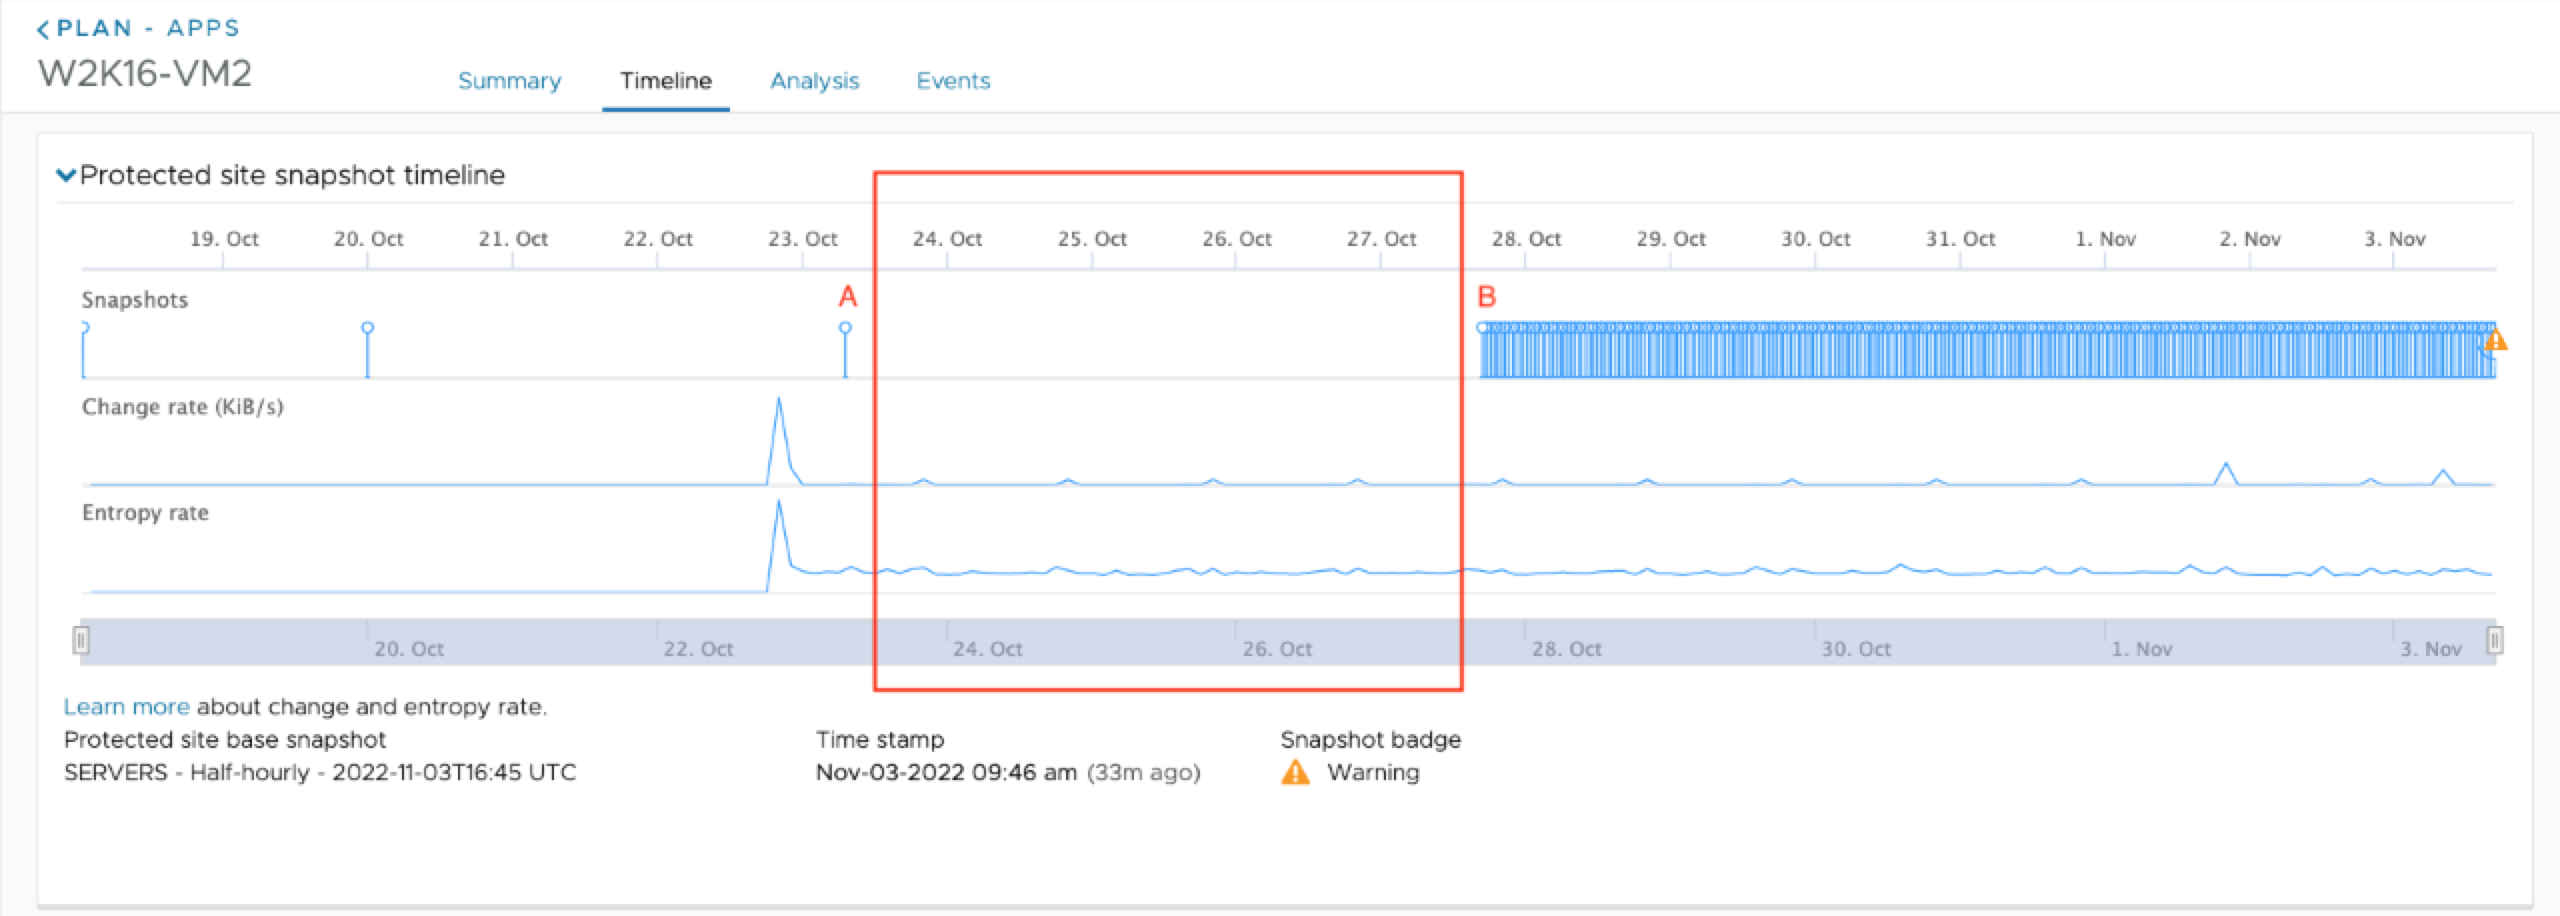
On the snapshot timeline, you might see changes in entropy rate and change rate, even where no snapshots show.
When you see entropy rate and change rate metrics where no snapshots exist, you are looking at data from expired snapshots. VMware Live Cyber Recovery retains metrics associated with expired snapshots to provide fine-grained data points that can help you discover anomalies on the snapshot history.
For example, you have snapshots A and B, yet on the snapshot timeline you see entropy rate and change rate data between the two snapshots. In this scenario, it indicates that there were snapshots between snapshots A and B that have expired.

If you see variations in entropy rate and change rate in the time interval between the two snapshots, it might indicate suspicious or malicious behavior during that time, so you can decide if you want to select a snapshot prior to A, or a later snapshot after B.