You can monitor the real time progress of snapshot replication tasks from the dashboard.
Replication progress shows you the percentage of data being transferred and the rate of data transferred ("logical throughput") during and after the task.
Replication Progress in the Task List
| Metric | Description |
|---|---|
| Start time |
Time when the task started. |
| End time/Progress |
During the task, you can see the percentage of the total task completed. When the task is finished, it shows the time of completion. |
| Logical throughput |
The progress during snapshot replication from a protected site to a cloud file system, since the start of the task. Measured in Megabits (Mbps) and Gigabits per second (Gbps). This measurement only displays while the task is in progress. |
Replication Statistics on Protected Site Page
The protected sites page shows replication statistics for both replication throughput and throttle (if configured), and also shows throughput for restore operations (during the operation).
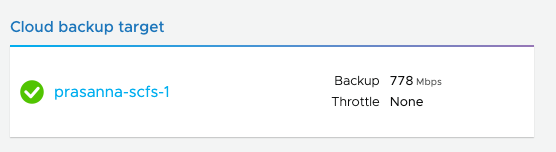
The protected site page also shows the current replication throttle maximum, if configured. You can also view replication transfer rate in the Topology pane.
If no snapshots are replicating to a cloud file system, then the throughput value is empty.
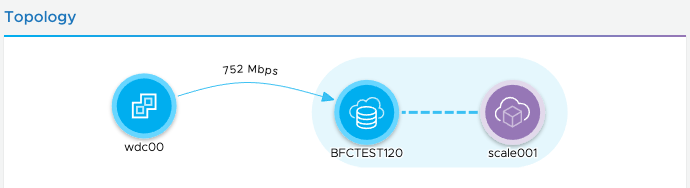
Replication Throughput in the Dashboard Topology Pane
The Topology map shows The rate of data being transferred to and from the protected site to a cloud file system, measured in Mbps and Gbps.