The Events list shows a running list of all VMware Live Cyber Recovery events that occur in the system, both system-generated events and user actions.
You can filter the Events list by:
- Event category, such as user operations ("Audit"), protection group and snapshot operations ("Protection"), protected site events ("Site"), recovery plan failovers, recovery SDDC events, and more.
- Event severity such as Info, Warning, Error, Emergency.
- Event duration, such as Today, Last 24 hours, Last 7 days, or any specific time frame you select.
You can also filter the events list page results further by text strings. This search filters the currently displayed list of events in the UI based on the entered text:
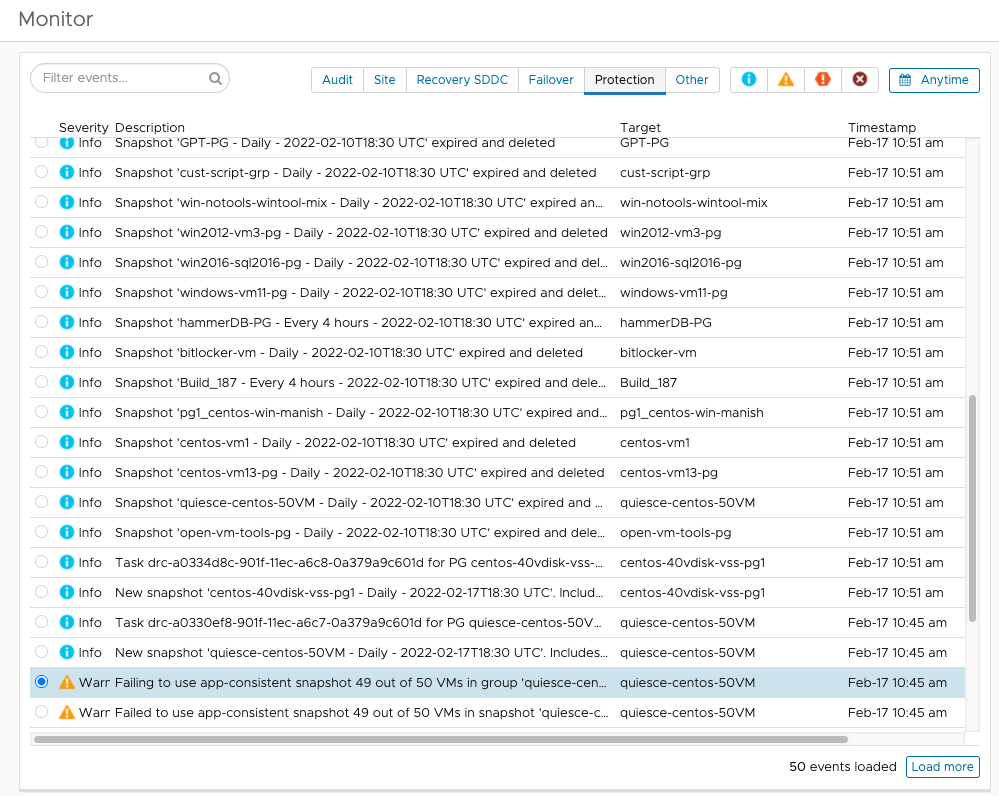
The Events list shows a maximum of 100 events at first viewing. To view more events, click the Load more button at the bottom of the page.
Event Details
When you select an event, a details panel opens to show more information about the event, such as event severity, timestamp, target system (replication or failover tasks), and description. For a snapshot task, the panel provides details about the protection group name, snapshot name, and VMs included in the snapshot. Some events, such as snapshot tasks, generate a log when completed, which you can access by clicking the Snapshot log button in the panel below the events.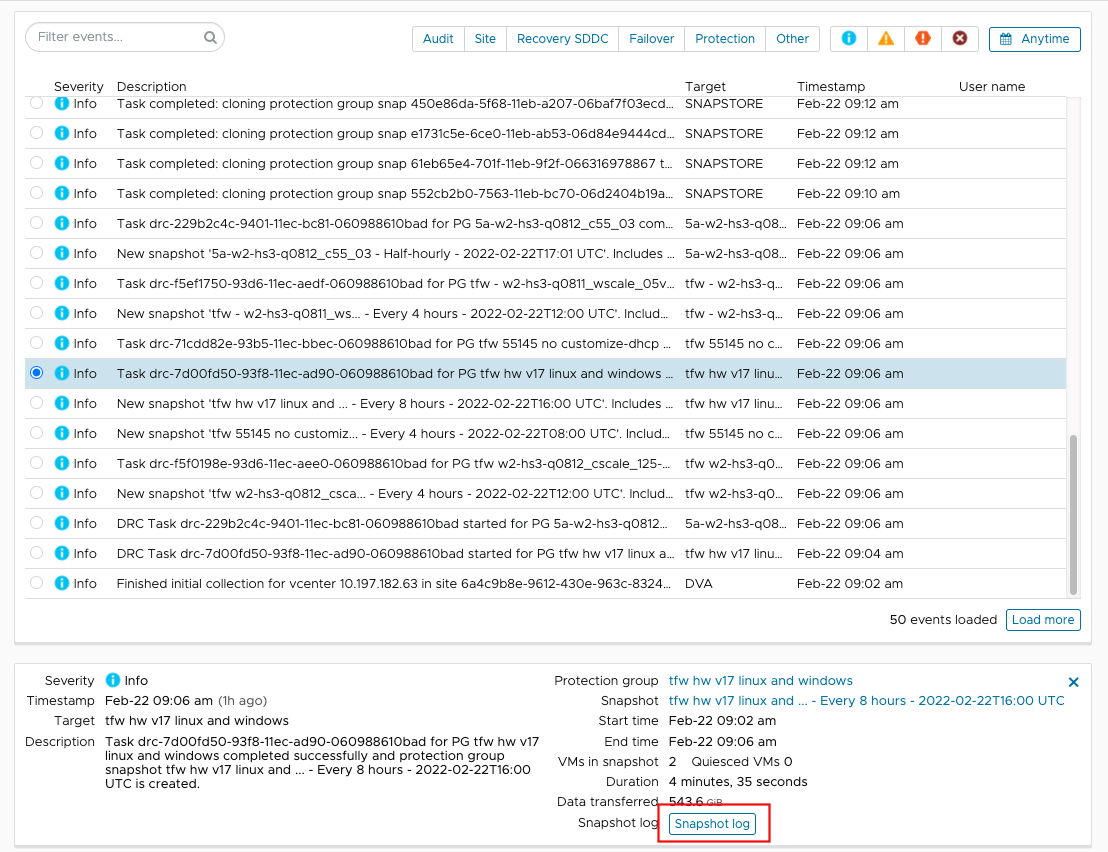
Event Types
| Event Type |
Description |
|---|---|
| Audit |
Events that capture user actions, such as configuration changes and recovery plan executions. Includes the event name, the user who performed it, and the source IP address where the event was initiated. |
| Site |
Events related to sites, such as adding or removing a protected site, downloading a Cyber Recovery connector VM, registering vCenter. |
| Recovery SDDC |
Events related to a recovery SDDC, such as deploying or deleting a recovery SDDC, adding or removing a network, and more. |
| Failover |
Events related to recovery plan operations, such as a recovery or failback operation, acknowledging and committing a plan, deleting a plan, and more. |
| Protection |
Events related to protection groups, such as creating or deleting protection groups, snapshots, and more. |
| Other |
Miscellaneous events, such as space reclamation tasks, user notifications for alert recipients, and more. |
Event Severities
| Severity |
Description |
|---|---|
| Info |
Descriptive information about an operation or state of the system, including information that might be useful. |
| Warning |
Indicates a situation that requires attention. A warning condition does not affect system operation. |
| Error |
Indicates that an operation failed or that there was a hardware error. An error condition does not affect continued system operation. |
| Emergency |
Indicates that a fatal event occurred. A fatal event affects continued system operation. |
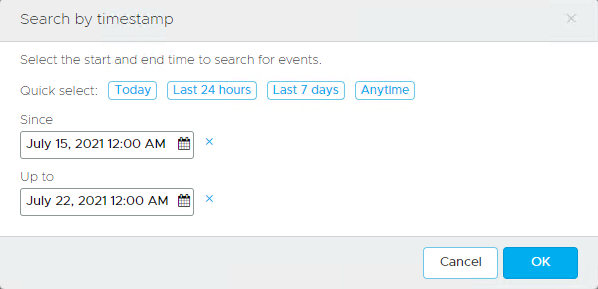
Event Timestamps
You can restrict the events displayed by timestamp, which allows you to set a specific time or time duration by which to filter events.
You can use the event timestamp filter when you want to see recent events, old events, or events that occurred during a specific time period.
You can select 'quick select' times, or use the Since and Up to calendar selectors to specify a time frame by which to filter the events.