This section discusses the various logs and troubleshooting options available for ICAP on NSX Advanced Load Balancer. The NSX Advanced Load Balancer UI and CLI can be used to check logs and error messages for analytics and troubleshooting.
Log for the requests that are handled by the ICAP server has an icap_log section populated.

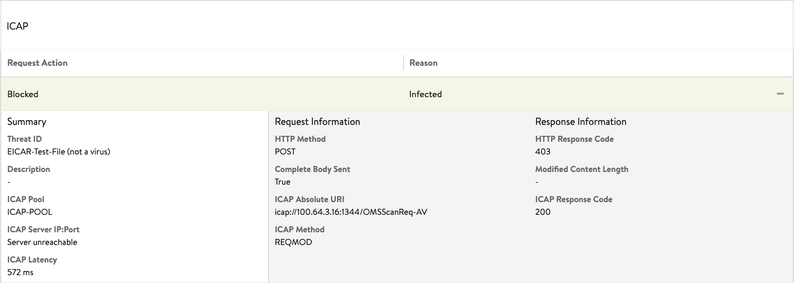
The following log exhibits ICAP scan detects an infection (JSON log file):
"icap_log": {
    "action": "ICAP_BLOCKED",
    "request_logs": [
        {
        "icap_response_code": 200,
        "icap_method": "ICAP_METHOD_REQMOD",
        "http_response_code": 403,
        "http_method": "HTTP_METHOD_POST",
        "icap_absolute_uri": "icap://100.64.3.15:1344/OMSScanReq-AV ",
        "complete_body_sent": true,
        "pool_name": {
        "val": "ICAP-POOL-GROUP",
        "crc32": 1799851903
        },
        "pool_uuid": "poolgroup-c7dd3b93-60c1-4190-b6d6-26c22d55dc30",
        "latency": "1275",
        "icap_headers_sent_to_server": "Host: 100.64.3.15:1344\r\nConnection: close\r\nPreview: 653\r\nAllow: 204\r\nEncapsulated: req-hdr=0, req-body=661\r\n",
        "icap_headers_received_from_server": "Date: Thu, 19 Nov 2020 13:55:00 G11T\r\nServer: Metadefender Core V4\r\nISTag: \"001605794100\"\r\nX-ICAP-Profile: File process\r\nX-Response-Info: Blocked\r\nX-Response-Desc: Infected\r\nX-Blocked-Reason: Infected\r\nX-Infection-Found: Type=0",
        "action": "ICAP_BLOCKED",
        "reason": "Infected",
        "threat_id": "EICAR-Test-File (not a virus)"
        }]
},
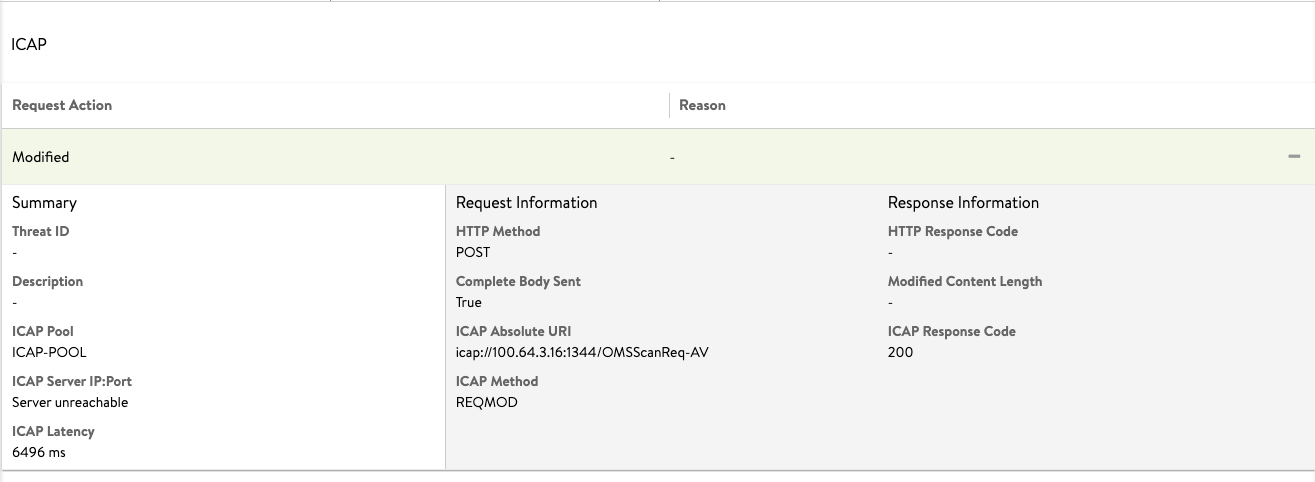
The following is the log entry when the ICAP server modifies the ICAP request:

The following log shows that the ICAP scan is performed successfully. The action field for the icap_log exhibits the value as
ICAP_PASSED.{"icap_log": {"action": "ICAP_PASSED", "request_logs": [{ "icap_response_code": 204, "icap_method": "ICAP_METHOD_REQMOD", "http_method": "HTTP_METHOD_POST", "icap_absolute_uri": "icap://100.64.3.15:1344/OMSScanReq-AV ", "complete_body_sent": true, "pool_name": {"val": "ICAP-POOL-GROUP", "crc32": 1799851903}, "pool_uuid": "poolgroup-c7dd3b93-60c1-4190-b6d6-26c22d55dc30", "latency": "456", "icap_headers_sent_to_server": "Host: 100.64.3.15:1344\r\nConnection: close\r\nPreview: 0\r\nAllow: 204\r\nEncapsulated: req-hdr=0, null-body=661\r\n", "icap_headers_received_from_server": "Date: Wed, 18 Nov 2020 12:54:06 G11T\r\nServer: Metadefender Core V4\r\nISTag: \"000000000096\"\r\nX-Response-Info: Allowed\r\nEncapsulated: null-body=0\r\n", "action": "ICAP_PASSED"}]}The log entries will show the action for icap_log as
ICAP_DISABLEDif the ICAP feature is not enabled."icap_log": {"action": "ICAP_DISABLED"}
Log Analytics
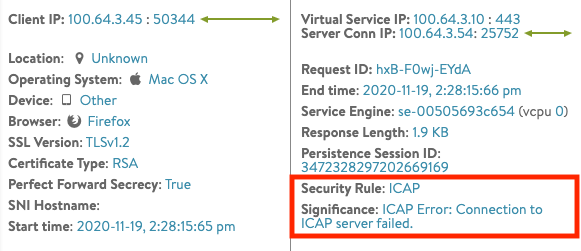
When ICAP is enabled, the log analytics on NSX Advanced Load Balancer provides an additional overview. All data items are clickable and allow the quick addition of filters for a detailed log view.
Troubleshooting

ICAP Server Error: The following example shows the ICAP Request is blocked. Misconfiguration of the ICAP server will exhibit the action for the ICAP log as ICAP_BLOCKED. The reason for the action is No security rule matched as available in the ICAP header.
"icap_log":
    {"action": "ICAP_BLOCKED",
    "request_logs":
      [{
        "icap_response_code": 200,
        "icap_method": "ICAP_METHOD_REQMOD",
        "http_response_code": 403,
        "http_method": "HTTP_METHOD_POST",
        "icap_absolute_uri": "icap://100.64.3.15:1344/OMSScanReq-AV ",
        "complete_body_sent": true, "pool_name": {"val": "ICAP-POOL-GROUP", "crc32": 1799851903}, "pool_uuid": "poolgroup-c7dd3b93-60c1-4190-b6d6-26c22d55dc30", "latency": "17",
        "icap_headers_sent_to_server": "Host: 100.64.3.15:1344\r\nConnection: close\r\nPreview: 0\r\nAllow: 204\r\nEncapsulated: req-hdr=0, null-body=661\r\n",
        "icap_headers_received_from_server": "Date: Thu, 19 Nov 2020 13:25:15 G11T\r\nServer: Metadefender Core V4\r\nISTag: \"001605792300\"\r\nX-Response-Info: Blocked\r\nX-Response-Desc: No security rule matched\r\nEncapsulated: res-hdr=0, res-body=91\r\n", "action": "ICAP_BLOCKED"}]}
To solve this issue, see the ICAP server used for the deployment.