


The Analytics tab of the New Virtual Service wizard defines how the NSX Advanced Load Balancer captures analytics for the virtual service. These settings control the thresholds for defining client experience and the resulting impact on end-to-end timing and the health score, the level of metrics collection, and the logging behavior.
Procedure
- Select an Analytics Profile from the drop-down menu. This profile determines the thresholds for determining client experience. It also defines errors that can be tailored to ignore certain behavior that might not be an error for a site, such as an HTTP 401 (authentication required) response code. The NSX Advanced Load Balancer uses errors and client experience thresholds to determine the health score of the virtual service and might generate significant log entries for any issues that arise.
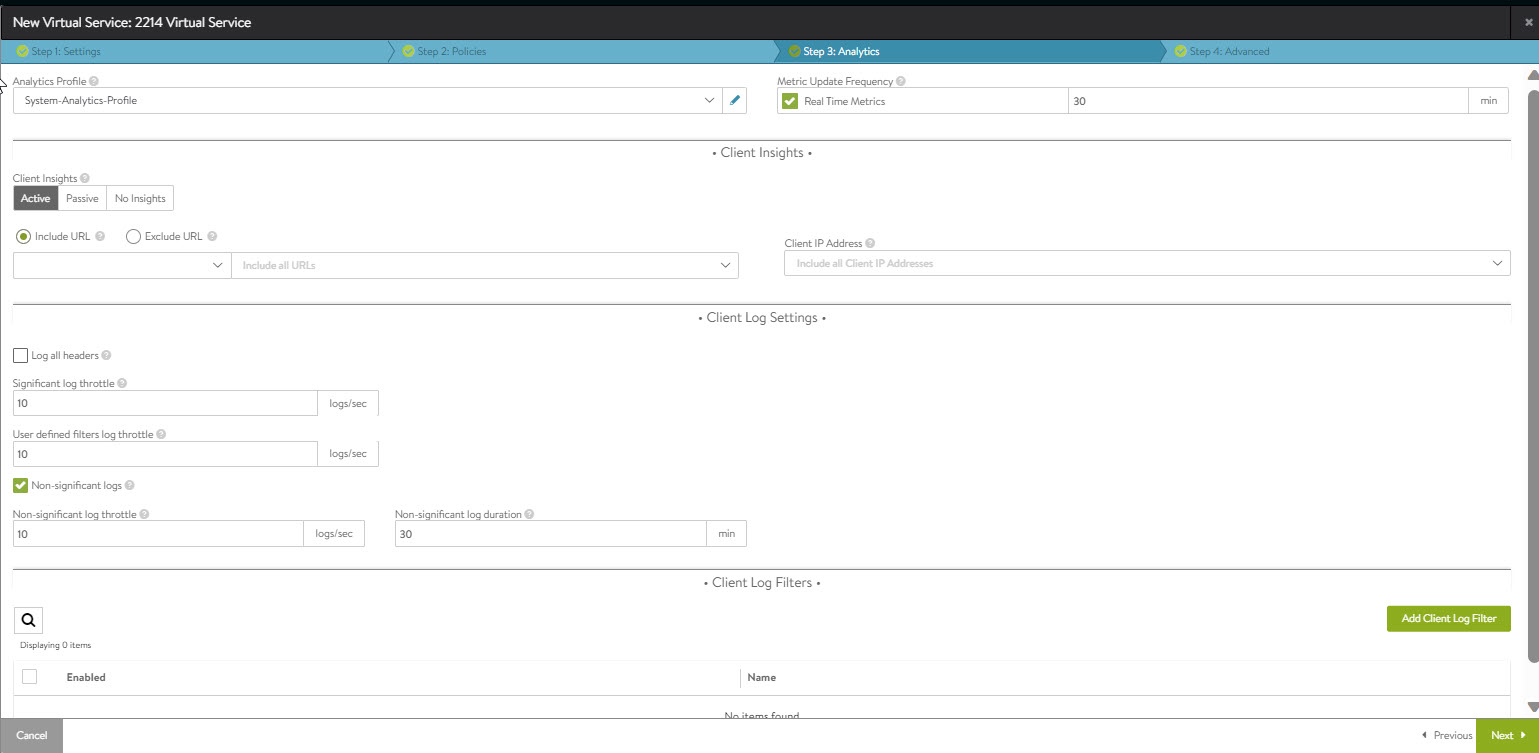
- There are several number of metrics, such as End-to-End Timing, Throughput, Requests, and more. The NSX Advanced Load Balancer updates these metrics periodically, either at a default interval of five minutes, or as defined in the Metric Update Frequency. Enable Real Time Metrics to gather detailed metrics aggressively for a limited period, as required.
Enter 0 to collect metrics aggressive to indefinite periods of time
Enter a value, for example, 30 min to collect real-time metrics for the defined 30 minutes. After this period of time elapses, the metrics collection reverts to slower polling. The real-time metrics is helpful for troubleshooting.
-
Note:
Capturing real time metrics can negatively impact system performance for busy Controllers with large numbers of virtual services or configured with minimal hardware resource.
- Data about connecting clients can be captured using Client Insights. Specific clients may be included or excluded through the Include URL, client IP address, and exclude URL options. By default, No Insights is selected.
Option Description Active
For HTTP virtual services, the active mode goes further by inserting an industry-standard JavaScript query into a few server responses to provide HTTP navigation and resource timing. Client browsers transparently return more information about their experience loading the web page. NSX Advanced Load Balancer uses this information to populate the Navigation Timing and Top URL Timing metrics. A maximum of one HTTP web page per second will be selected for generating the sampled data.
Passive
Records data passively flowing through the virtual service. This option enables recording of the End-to-End Timing and client’s location. For HTTP virtual services, device, browser, operating system, and top URL metrics are also included. No agents or changes are made to client or server traffic.
No Insights
No client insights are recorded for this virtual service.
- SelectInclude URL or Exclude URL to define URL patterns when insterting the RUM script.
- Enter the Client IP Address to check when inserting RUM script.
- Configure user-defined logging under Client Log Settings. Click Log all headers to include all the headers.
- Enter the number of significant logs to be generated per second for this virtual service on each SE as Significant log throttle. The default value is 10 sec per sec. Setting this value to 0 deactivates throttling for significant logs.
- Enter User defined filters log throttle to limit the total number of UDF logs generated per second for this virtual service on each SE.
- Select Non-significant logs to capture all client logs, including connections and requests.
- Enter the number of non-significant logs to be generated per second for this virtual service on each SE as Non-significant log throttle. The default value is 10 sec per sec. Setting this value to 0 deactivates throttling for for non-significant logs.
- Enter the Non-significant log duration in minutes.
- Click Add Client Log Filter. In the Add Client Log Filter section configure the following.
- Enter the Filter Name.
- Enable Log all headers and configure the Duration in minutes.
- Select the condition for the match under Matching Filter. For example, Client IP.
- Select the criteria to match the filter. For example, Is 1.1.1.1. The filter will take effect if the client IP address is 1.1.1.1.
- Click Add Item to add another critera for the same filter.
- Filter based on the request’s Path and select the required Match criteria and add a string group or enter a custom string, as required.
- Click Next to view Step 4: Advanced.
