Pools maintain the list of servers assigned to them and perform health monitoring, load balancing, persistence, and functions that involve NSX Advanced Load Balancer-to-server interaction. This topic explains the different features of server pools in NSX Advanced Load Balancer including pool analytics, logs, health, events, alerts, and more.
A typical virtual service will point to one pool. However, more advanced configurations may have a virtual service content switching across multiple pools through HTTP Request Policies or DataScripts. A pool may only be used or referenced by only one virtual service at a time.

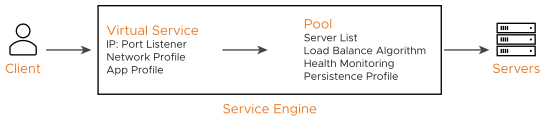
Creating a virtual service using the basic method automatically creates a new pool for that virtual service, using the name of the virtual service with a -pool appended. When creating a virtual service through the advanced mode, an existing, unused pool may be specified, or a new pool may be created.
Pools Page
Navigate to
to open the pools page. This page displays a high-level overview of configured pools.You can create a new pool by clicking CREATE POOL, or edit the pool by clicking the pencil icon.
The information for each pool is viewed as shown below:
Field |
Description |
---|---|
Name |
Lists the name of each pool. Clicking the name opens the Analytics tab of the Pool Details page. |
Health |
Represents the health using both a number from 1-100 and a color-coded status to provide quick information about the health of each pool. This will be gray if the pool is unused, such as not associated with a virtual service or associated with a VS that can not or has not been placed on a Service Engine.
|
Servers |
Displays the number of servers in the pool that are up out of the total number of servers assigned to the pool. For instance, 2/3 indicates that two of the three servers in the pool are successfully passing health checks and are considered up. |
Virtual Service |
The VS the pool is assigned to. Clicking a name in this column opens the VS Analytics tab of the Virtual Service Details page. If no virtual service is listed, this pool is considered unused. |
Cloud |
It displays the relevant cloud. |
RPS |
It indicates the performance of the CPU. |
Open Conns |
It displays the open conns of the respective pool. |
Throughput |
Thumbnail chart of the throughput in Mbps for each pool for the time frame selected.
|
Pool Details
Clicking a pool brings up the pool details where you can see deeper insights into the current pool.

Pool Analytics Page
The pool’s Analytics tab presents information about pool performance metrics. The data shown is filtered by the time period selected.

Pool End-to-End Timing
The End-to-End Timing pane at the top of the Analytics tab of the Pool Details page provides a high-level overview of the quality of the end-user experience and where any slowdowns may be occurring. The chart breaks down the time required to complete a single transaction, such an HTTP request.
It may be helpful to compare the end-to-end time against other metrics, such as throughput, to see how traffic increases impact the ability of the application to respond. For instance, if new connections double but the end-to-end time quadruples, you may need to consider adding more servers.

From left to right, this pane displays the following timing information:
Field |
Description |
---|---|
Server RTT |
This is Service Engine to server round trip latency. An abnormally high server RTT may indicate either that the network is saturated or more likely that a server’s TCP stack is overwhelmed and cannot quickly establish new connections. |
App Response |
The time the servers take to respond. This includes the time the server took to generate content, potentially fetch back-end database queries or remote calls to other applications, and begin transferring the response back to NSX Advanced Load Balancer. This time is calculated by subtracting the Server RTT from the time of the first byte of a response from the server. If the application consists of multiple tiers (such as web, applications, and database), then the App Response represents the combined time before the server in the pool began responding. This metric is only available for a layer 7 virtual service. |
Data Transfer |
Represents the average time required for the server to transmit the requested file. This is calculated by measuring from the time the Service Engine received the first byte of the server response until the client has received the last byte, which is measured as the when the last byte was sent from the Service Engine plus one half of a client round trip time. This number may vary greatly depending on the size of objects requested and the latency of the server network. The larger the file, the more TCP round trip times are required due to ACKs, which are directly impacted by the client RTT and server RTT. This metric is only used for a Layer 7 virtual service. |
Total Time |
Total time from when a client sent a request until they receive the response. This is the most important end-to-end timing number to watch, because it is the sum of the four metrics. As long as it is consistently low, the application is probably successfully serving traffic. |
Pool Metrics
The sidebar metrics tiles contain the following metrics for the pool. Clicking any metric tile will change the main chart pane to show the chosen metric.
Field |
Description |
---|---|
End to End Timing |
Shows the total time from the pool’s End to End Timing graph. To see the complete end-to-end timing, including the client latency, refer to Analytics tab of the Virtual Service Details page, which includes the client to Service Engine metric. ![]() |
Open Connections |
The number of open (existing) connections during the selected time period. ![]() |
New Connections |
The number of client connections that were completed or closed over the selected time period. Refer to this article for an explanation of new versus closed connections per second. ![]() |
Throughput |
Total bandwidth passing between the virtual service and the servers assigned to the pool. This throughput number may be different than the virtual service throughput, which measures throughput between the client and the virtual service. Many features may affect these numbers between the client and server side of NSX Advanced Load Balancer, such as caching, compression, SSL, and TCP multiplexing. Hovering your mouse pointer over this graph displays the throughput in Mbps for the selected time period. ![]() |
Requests |
The number of HTTP requests sent to the servers assigned to the pool. This metric also shows errors sent to servers or returned by servers. Any client requests that received an error generated by NSX Advanced Load Balancer as a response (such as a 500 when no servers are available) are not forwarded to the pool and not tracked in this view. ![]() |
Servers |
Displays the number of servers in the pool and their health. The X-axis represents the number of HTTP requests or connections to the server, while the Y-axis represents the health score of the server. The chart enables you to view servers in relation to their peers within the pool, thus helping to spot outliers. Within the chart pane, click and drag the mouse-over server dots to select and display a table of the highlighted servers below the Chart pane. The table provides more details about these servers, such as hostname, IP address, health, new connections or requests, health score, and the server’s static load balanced ratio. Clicking on the name of a server will jump to the pool’s Server Insight page, which shows health and resource status. ![]() |
Pool Chart Pane
The main chart pane in the middle of the Analytics tab displays a detailed historical chart of the selected metric tile for the current pool.
Hovering the mouse over any point in the chart will display the results for that selected time in a popup window.
Clicking within the chart will freeze the popup. This may be useful when the chart is scrolling as the display updates over time.
Clicking again will unfreeze the highlighted point in time.

Many charts contain radio buttons in the top right that allow customization of data that must be included or excluded from the chart. For instance, if the End to End Timing chart is heavily skewed by one very large metric, then deselecting that metric by clearing the appropriate radio button will re-factor the chart based on the remaining metrics shown. This may change the value of the vertical Y-axis.
Some charts also contain overlay items, which will appear as color-coded icons along the bottom of the chart.
Pool Overlays Pane
The overlays pane is used to highlight important events within the timeline of the chart pane. This feature helps correlate anomalies, alerts, configuration changes, or system events with changes in traffic patterns.

Within the overlays pane:
Each overlay type displays the number of entries for the selected time period.
Clicking an overlay button toggles that overlay’s icons in the chart pane. The button lists the number of instances (if any) of that event type within the selected time period.
Selecting an overlay button displays the icon for the selected event type along the bottom of the chart pane. Multiple overlay icon types may overlap. Clicking the overlay type’s icon in the chart pane will display more data below the overlay Items bar. The following overlay types are available:
Anomalies — Display anomalous traffic events, such as a spike in server response time, along with corresponding metrics collected during that time period.
Alerts — Display alerts, which are filtered system-level events that have been deemed important enough to notify an administrator.
Config Events — Display configuration events, which track configuration changes made to NSX Advanced Load Balancer by either an administrator or an automated process.
System Events — Display system events, which are raw data points or metrics of interest. System Events can be noisy, and are best used as the basis of alerts which filter and classify raw events by severity.
Pool Anomalies Overlay
The anomalies overlay displays periods during which traffic behavior was considered abnormal based on recent historical moving averages. Changing the time interval will provide greater granularity and potentially show more anomalies.
Clicking Anomalies Overlay button displays yellow anomaly icons in the chart pane. Selecting one of these icons within the chart pane brings up more information in a table at the bottom of the page. During times of anomalous traffic, NSX Advanced Load Balancer records any metrics that have deviated from the norm, which may provide hints as to the root cause of the anomaly.
An anomaly is defined as a metric that has a deviation of 4 sigma or greater across the moving average of the chart.
Anomalies are not recorded or displayed while viewing with the real-time display period.
Field |
Description |
---|---|
Timestamp |
Date and time when the anomaly was detected. This may either span the full duration of the anomaly, or merely be near the same time window. |
Type |
The specific metric deviating from the norm during the anomaly period. To be included, the metric deviation must be greater than 4 sigma. Numerous types of metrics, such as CPU utilization, bandwidth, or disk I/O may trigger anomalous events. |
Entity |
Name of the specific object that is reporting this metric. |
Entity Type |
Type of entity that caused the anomaly. This may be one of the following:
|
Time Series |
Thumbnail historical graph for the selected metric, including the most current value for the metric which will be data on the far right. Moving the mouse over the chart pane will show the value of the metric for the selected time. Use this to compare the normal, current, and anomaly time periods. |
Deviation |
Change or deviation from the moving average, either higher or lower. The time window for the moving average depends on the time series selected for the Analytics tab. |
Pool Alerts Overlay
The alerts overlay displays the results of any events that meet the filtering criteria defined in the alerts tab. Alerts notify administrators about important information or changes to a site that may require immediate attention.
Alerts may be transitory, meaning that they may expire after a defined period of time. For instance, NSX Advanced Load Balancer may generate an alert if a server is down and then allow that alert to expire after a specified time period once the server comes back online. The original event remains available for later troubleshooting purposes.
Clicking the alerts icon in the overlay items bar displays any red alerts icons in the chart pane. Selecting one of these chart alerts will display more information below the overlay Items bar, which will show the following information:
Field |
Description |
---|---|
Timestamp |
Date and time when the alert occurred. |
Resource Name |
Name of the object that is reporting the alert. |
fLevel |
Severity of the alert. You can use the priority level to determine whether more notifications are required, such as sending an email to administrators or sending a log to Syslog servers. The level may be one of the following:
|
Summary |
Brief description of the event. |
Pool Config Events overlay
The config events overlay displays configuration events, such as changing the NSX Advanced Load Balancer configuration by adding, deleting, or modifying a pool, virtual service, or Service Engine, or an object related to the object being inspected. If traffic dropped off at precisely 10:00am, and at that time an administrator made a change to the virtual services security settings, there’s a good chance the cause of the change in traffic was due to the incorrect configuration.

Clicking Config Events icon in the Overlay Items bar displays any blue config event icons in the chart pane. Selecting one of these chart alerts will display more information below the Overlay Items bar, which will show the following information:
Field |
Description |
---|---|
Timestamp |
Date and time when the configuration change occurred. |
Resource Type |
This event type will always be scoped to configuration event types. |
Resource Name |
Name of the object that has been modified. |
Event Code |
|
User |
It displays the user. |
Description |
Brief description of the event. |
Expand/Contract |
Clicking the plus (+) or minus sign (-) for a configuration event either expands or contracts a sub-table showing more detail about the event. When expanded, this shows a difference comparison of the previous configuration versus the new configuration, as follows:
|
Pool System Events Overlay
This overlay displays system events relevant to the current object, such as a server changing status from up to down or the health score of a virtual service changing from 50-100.
Clicking the system events icon in the overlay items bar displays any purple system event icons in the Chart Pane. Select a system event icon in the chart pane to display more information below the overlay items bar.
Field |
Description |
---|---|
Timestamp |
Date and time when the system even occurred. |
Event Type |
This will always be system |
Resource Name |
Name of the object that triggered the event. |
Resource Type |
Type of the resource. For example, POOL, POOLSERVER, and so on. |
Event Code |
High-level definition of the event, such as VS_Health_Change or VS_Up. |
Description |
Brief description of the system event. |
Expand/Contract |
Clicking the plus (+) or minus sign (-) for a system event expands or contracts that system event to show more information. |
Pool Logs Page
Client logs viewed from within a pool are identical to the logs shown within a virtual service, except they are filtered to only show log data specific to the pool. For instance, information such as End to End Timing is only shown from the Service Engine to the servers, rather than from the clients to the servers. Viewing logs within a pool may be useful when a virtual service is performing content switching across multiple pools. It is still possible within the virtual service logs page to add a filter for a specific pool, which would then provide complete End to End Timing for connections or requests sent to the specified pool.
For the complete descriptions of logs,see Virtual Service Application Logs in NSX Advanced Load BalancerMonitoring and Operability Guide
Pool Health Page
The health tab presents a detailed breakdown of health score information for the pool.

The health score of a pool is comprised of the following scores:
Field |
Description |
---|---|
Performance Score |
Performance score (1-100) for the selected item. A score of 100 is ideal, meaning clients are not receiving errors and connections or requests are quickly returned. |
Resources Score |
Any score assessed because of resource availability issues is assigned a score, which is then subtracted from the performance score. A penalty score of 0 is ideal, meaning there are no obvious resource constraints on NSX Advanced Load Balancer or servers. |
Anomaly Score |
Any score assessed because of anomalous events is assigned a score, which is then subtracted from the performance score. An ideal score is 0, which means NSX Advanced Load Balancer has not seen recent anomalous traffic patterns that may imply future risk to the site. |
Health Score |
The final health score for the selected item equals the performance score minus the Resource and anomaly penalty scores |
This will display more sub-metrics which feed into the top-level metric/tile selected. Hover the mouse over a time period in the main chart to see the description of the score degradation. Some tiles may have more information shown in the main chart section that requires scrolling down to view.
Pool Servers Page
Information for each server within a pool is available on the Server Details page. This page offers views into the correlation between server resources, application traffic, and response times.
Server Page
The Server Page may be accessed by clicking on the server’s name from either the Server Details page, the server shown is within the context of the pool it was selected within. Rephrased, if the server (IP: Port) is a member of two or more pools, the stats, and health monitors shown are only for the server within the context of the viewed pool.
page or the tile. When viewing theNot all metrics within the Server Page are available in all environments. For instance, servers that are not virtualized or hooked into a hypervisor are not able to have their physical resources displayed.

The statistics can be changed or skewed by switching between Average Values, Peak Values, and Current Values. To see the highest CPU usage over the past day, change the time to 24 hours and the Value to Peak. This will show the highest stats recorded during the past day.
Field |
Description |
---|---|
CPU Stats |
The CPU Stats box shows the CPU usage for this server, the average during this time period across all servers in the pool, and the hypervisor host. |
Memory Stats |
The memory Stats box shows the Memory usage for this server, the average during this time period across all servers in the pool, and the hypervisor host. |
Health Monitor |
This table shows the name of any health monitors configured for the pool. The Status column shows the most current up or down health of the server. The Success column shows the percentage of health monitors that passed or failed during the display time frame. Clicking the plus will expand the table to show more info for a down server. See the topic Reasons Servers Marked Down in VMware NSX Advanced Load Balancer Monitoring and Operability Guide. |
Main Panel |
The large panel shows the highlighted metric, similar to the Virtual Service Details and Pool Details pages. Overlay Items show anomalies, alerts, configuration events, and system events that are related to this server within the pool. |
Pool Tile Bar |
The pool in the top right bar shows the health of the pool. This can also be used to jump back up to the Pool Page. Under the pool name is a pull-down menu that enables quick access to jump to the other servers within the pool. |
Metrics Tile Bar |
The metrics options will vary depending on the hypervisor NSX Advanced Load Balancer is plugged into. For non-virtualized servers, the metrics are limited to non-resource metrics, such as end-to-end timing, throughput, open connections, new connections, and requests. Other metrics that may be shown include CPU, memory, and virtual disk throughput. |
Pool Events Page
The Events tab presents system-generated events over the time period selected for the pool. System events apply to the context in which you are viewing them. For instance, when viewing events for a pool, only events that are relevant to that pool are displayed.

The following fields are available in this screen:
Field |
Description |
---|---|
Search |
The search field enables you to filter the events using whole words contained within the individual events. |
Refresh |
Clicking on refresh updates the events displayed for the currently selected time. |
Include Internal |
By default, several events are not shown here as they tend to be noisy and less relevant for general purpose. Enable this option to troubleshoot for esoteric issues. |
Include System Events |
System generated configuration events are displayed by default. To exclude system generated configuration events, deselect the Include System Events check box. |
Number |
The total number of events being displayed. The date/time range of those events appears beneath the search field on the left. |
Clear Selected |
If filters have been added to the Search field, clicking the Clear Selected (X) icon on the right side of the search bar will remove those filters. Each active search filter will also contain an X that you can click to remove the specific filter. |
Histogram |
The histogram shows the number of events over the period of time selected. The X-axis is time, while the Y-axis is the number of events during that bar’s period of time.
|
Field |
Description |
---|---|
Timestamp |
Date and time the event occurred. Highlighting a section of the histogram provides further filtering of events within a smaller time window. |
Event Type |
This may be one of the following:
|
Resource Name |
Name of the object related to the event, such as the pool, virtual service, Service Engine, or Controller. |
Event Code |
A short event definition, such as Config_Action or Server_Down. |
Description |
A complete event definition. For configuration events, the description will also show the user that made the change. |
Expand/Contract |
Clicking the plus (+) or minus sign (-) for an event log either expands or contracts that event log. Clicking the + and – icons in the table header expands and collapses all entries in this tab. |
New fields will appear highlighted in green in the new configuration
Removed fields will appear highlighted in red.
Changed fields will show highlighted in yellow
Pool Alerts Page
The alerts tab displays user-specified events for the selected time period. You can configure alert actions and proactive notifications through Syslog or email in the Notifications tab of the Administration page. Alerts act as filters that provide notification for prioritized events or combinations of events through various mechanisms. NSX Advanced Load Balancer includes default alerts based on events deemed to be universally important.

The top of this tab shows the following items:
Field |
Description |
---|---|
Search |
The search field enables you to filter the alerts using whole words contained within the individual alerts. |
Refresh |
Clicking on refresh updates the alerts displayed for the currently-selected time. |
Number |
The total number of alerts being displayed. The date or time range of those alerts appear beneath the search field on the left. |
Dismiss |
Select one or more alerts from the table below then click dismiss to remove the alert from the list. |
The table at the bottom of the Alerts tab displays the following alert details:
Field |
Description |
---|---|
Timestamp |
Date and time when the alert was triggered. Changing the time interval using the display pull-down menu may potentially show more alerts. |
Resource Name |
Name of the object that is the subject of the alert, such as a Server or virtual service. |
Level |
Severity level of the alert, which can be high, medium, or low. Specific notifications can be set up for the different levels of alerts through the Administration page’s Alerts Overlay. |
Summary |
Summarized description of the alert. |
Action |
Click the appropriate button to act on the alert. |
Expand/Contract |
Clicking the plus (+) or minus sign (-) for an event log either expands or contracts that event log to display more information. Clicking the + and – icon in the table header expands and collapses all entries in this tab. |