


No Data in analytic or log graph on NSX Advanced Load Balancer UI indicates that a particular event or entity has no data to display.
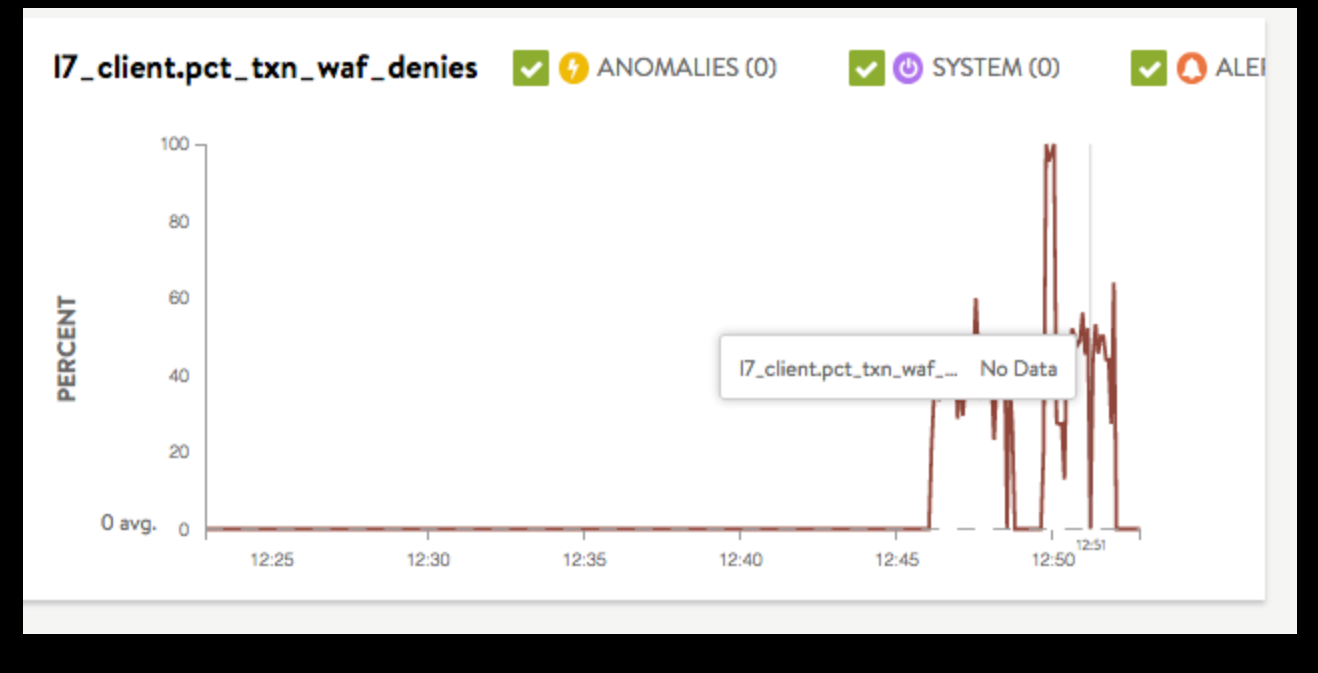
In the below screenshot, No Data is observed for a section of the log chart for a virtual service.
The following could be one of the reasons for NSX Advanced Load Balancer UI to display No Data in the log charts or the log graphs.
NSX Advanced Load Balancer upgrade process is in progress.
NSX Advanced Load Balancer Service Engine is overloaded and is not able to send metrics to NSX Advanced Load Balancer Controller to analyze the data.
NSX Advanced Load Balancer Controller is slow in processing data.
There is no valid request to define the data (for example, latency).
Additional Information
NSX Advanced Load Balancer UI hosts different types of events, logs, graphs, and so on, which helps an admin to check and troubleshoot various performance or outage issues.
For example, to check client logs for any virtual service, navigate to . Select the desired virtual service and click Logs.
For more information about various analytics and log options available on NSX Advanced Load Balancer UI, see:
For more information on WAF monitoring, see WAF Monitoring topic in the VMware NSX Advanced Load BalancerWAF Guide.
