


The SEs send metrics data to the Controllers. The Controllers monitor the data and send alarm and notify the customer when the data is up to some thresholds.
The following is the process to configure dynamic thresholds using the CLI configuration in the Controller shell:
[admin:avi-ctrl]: > configure serviceenginegroup Default-Group
[admin:avi-ctrl]: serviceenginegroup> se_group_analytics_policy
[admin:avi-ctrl]: serviceengine:se_group_analytics_policy > metrics_event_thresholds
New object being created
[admin:avi-ctrl]: serviceenginegroup:se_group_analytics_policy:metrics_event_thresholds> metrics_event_threshold_type se_cpu_threshold
[admin:avi-ctrl]: serviceenginegroup:se_group_analytics_policy:metrics_event_thresholds> reset_threshold 30
[admin:avi-ctrl]: serviceenginegroup:se_group_analytics_policy:metrics_event_thresholds> watermark_thresholds 56
[admin:avi-ctrl]: serviceenginegroup:se_group_analytics_policy:metrics_event_thresholds> save
[admin:avi-ctrl]: serviceenginegroup:se_group_analytics_policy> save
[admin:avi-ctrl]: serviceenginegroup:> save
The following are the field details:
SeGroupAnalyticsPolicy: The analytics policy which defines the common thresholds for all SEs within the same SE group.metrics_event_thresholds: The thresholds for various events generated by the metrics system.THRESHOLD_TYPE_STATIC: The default metrics event type threshold for allMetricsRuleobjects.SE_CPU_THRESHOLD: The dynamic threshold type for metrics rules for Service Engine CPU usage.SE_MEM_THRESHOLD: The dynamic threshold type for metrics rules for Service Engine Memory usage.SE_DISK_THRESHOLD: The dynamic threshold type for metrics rules for Service Engine Disk usage.reset_threshold: The value used to reset the event state machine.watermark_threshold: The threshold value for which event in raised. There can be multiple thresholds defined. Health score degrades when the the target is higher than this threshold.
If the Service Engine CPU usage is higher than 56%, you can view SE_CPU_HIGH event in the Controller UI.

There will be another SE_CPU_HIGH event if the SE CPU usage is lower than reset_threshold event and higher than watermark_threshold event.
Workflow
The following is the graphical representation for SE CPU usage:
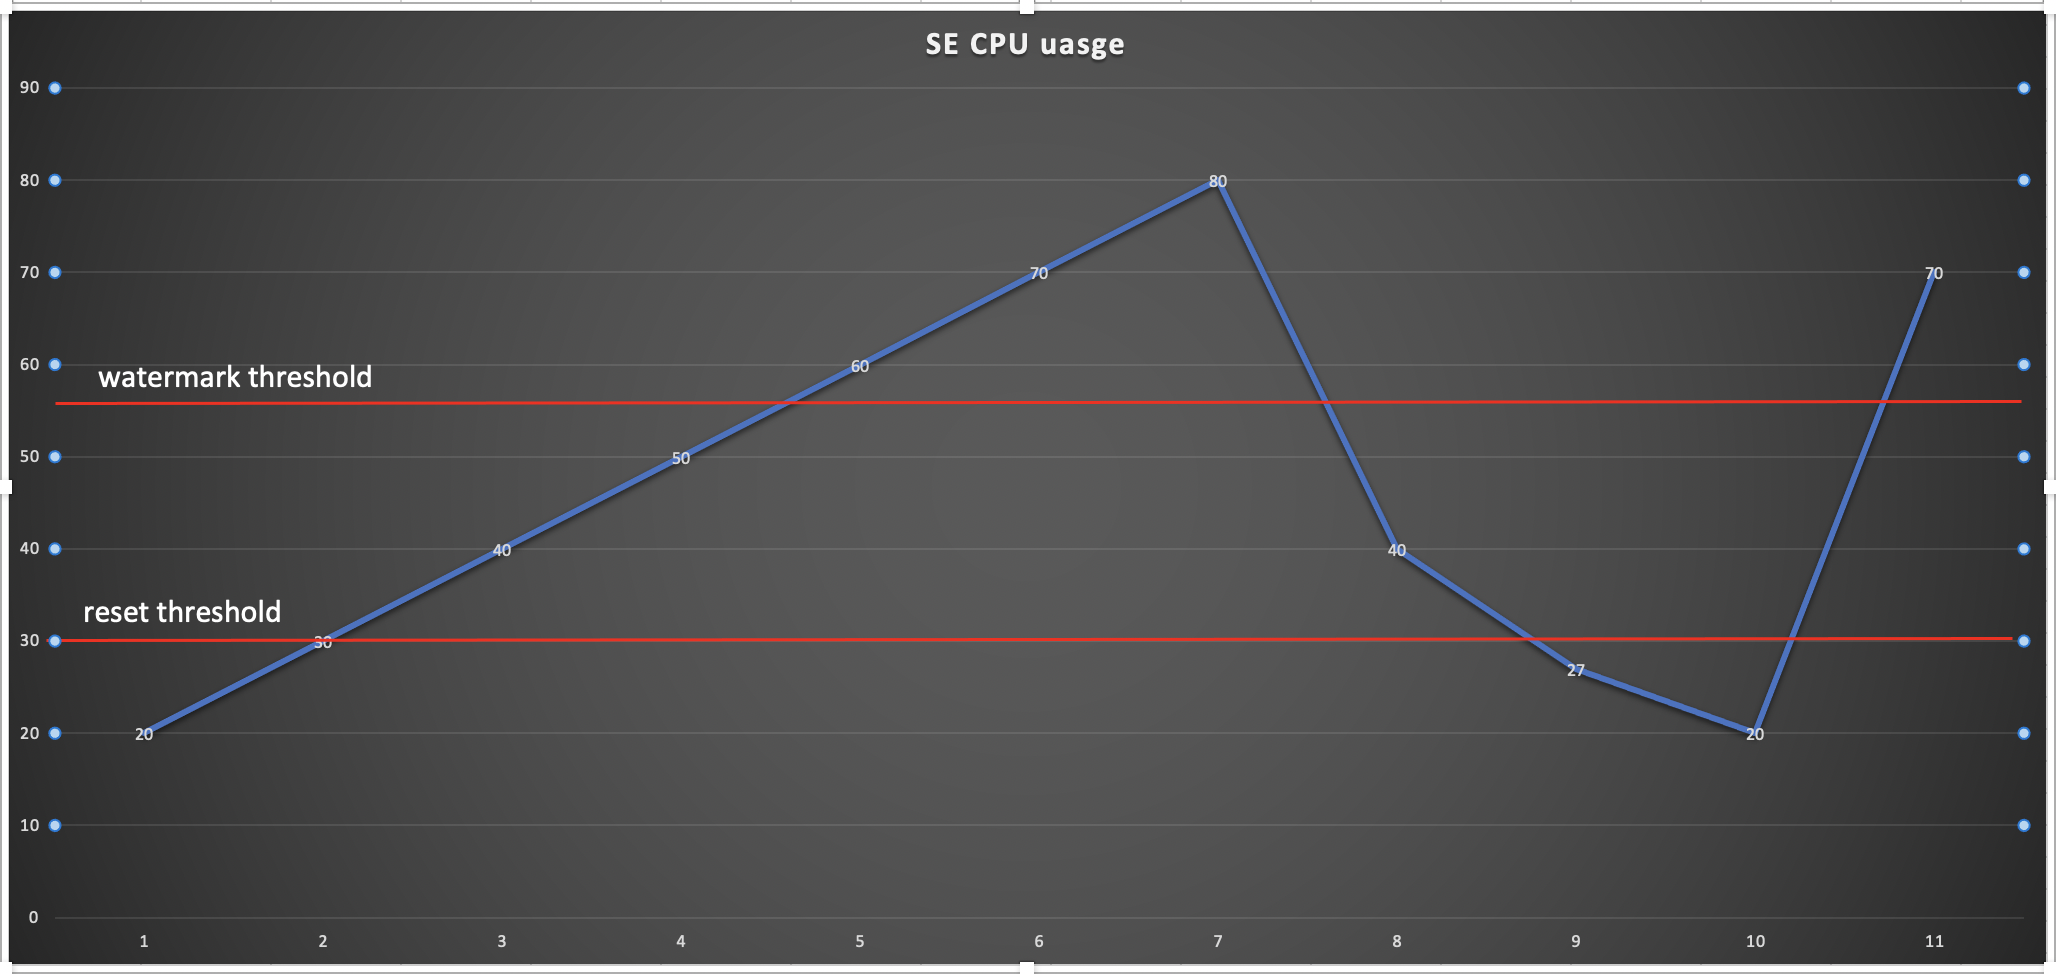
In the above image, X-axis represents the time and Y-axis represents SE CPU usage in percentage.
If you monitor and record the SE CPU usage every five minutes (time interval is 5 minutes), each time point in the X-axis is the monitored time point.
From time 1 to time 4, the SE CPU usage is lower than the watermark threshold 56%, so no SE_CPU_HIGH event is generated.
At time 5, the SE CPU usage is 60%, which is higher than the watermark threshold, hence the SE_CPU_HIGH event is generated in the Controller UI.
From time 6 to time 8, since one SE_CPU_HIGH event is already generated and the current SE CPU usage is higher than the reset threshold 30%, hence the repeated SE_CPU_HIGH event will not be generated.
At time 9, the SE CPU usage is lower than the reset threshold, the state machine in the background should be reset.
At time 10, the SE CPU usage is lower than the watermark threshold, no SE_CPU_HIGH event is generated.
At time 11, the SE CPU usage is higher than the watermark threshold after it is reset, hence another SE_CPU_HIGH event is generated in the Controller UI.
Example to setup the Controller Dynamic CPU Thresholds
> configure systemconfiguration
	> controller_analytics_policy
		> metrics_event_thresholds
			> metrics_event_threshold_type controller_cpu_threshold
			> reset_threshold 20
			> watermark_thresholds 30
			> save
