


NSX Advanced Load Balancer has a built-in indexing and searching service that provides analytics of the application traffic and NSX Advanced Load Balancer system and configuration events. Some customers wish to incorporate the data into a pre-existing log management system (for example, Splunk, Sumo Logic, rsyslog/elasticsearch, and so on).
NSX Advanced Load Balancer can stream application logs directly to an external server as shown below. The logs are streamed as UDP messages directly from the NSX Advanced Load Balancer Service Engines. Customers can provide external server information in a new option under Analytics Profile, client_log_streaming_config. Traffic logs of any virtual service that uses (such an analytics profile) are automatically streamed from the SE(s) on which that virtual service is placed. SEs use their management interface to connect to a configured external server.

Enabling Application Log Streaming through NSX Advanced Load Balancer CLI
Create a new AnalyticsProfile object or edit an existing one and set the following fields under the client_log_streaming_config subsection for streaming application logs:
external_server: The destination server IP address or hostname. If a hostname is provided, it must be resolvable on NSX Advanced Load Balancer Service Engines. NSX Advanced Load Balancer supports multiple servers by furnishing a comma-separated list of IP addresses or host names, for example, 11.11.11.11, 23.12.12.4. Optionally, a separate port can be specified for each external server in the list, for instance, 11.11.11.11:234, 12.12.12.12:343. To resolve domain names, the name servers can be configured on the Service Engine. For more information, see DNS Resolution on Service Engine topic in the VMware NSX Advanced Load BalancerConfiguration Guide.
The subsection below provides a CLI example:
external_server_port: The destination server’s service port. The default for this is 514. If multiple external servers have been identified, the single port number specified here will apply to all but those servers for which an explicit port number has been specified in the external server list.log_types_to_send: Type of logs to stream to the external server. Default islogs_all, that is, send all logs. Other options are:logs_significant_only: Only significant logslogs_udf_only: Only logs that match any client log filters or rules with logging enabledlogs_udf_significant: Significant logs and logs that match any client log filters or rules with logging enabled
max_logs_per_second: This setting limits the number of logs streamed per VS from each SE to the external server. By default, 100 logs per second are streamed. Set this to zero(0) to not enforce any limit.
See the notes in Rate Limiting section below before making any changes to this variable.
[admin:node-1]: > configure analyticsprofile streaming-profile
[admin:node-1]: analyticsprofile> client_log_streaming_config
[admin:node-1]: analyticsprofile:client_log_streaming_config> external_server 10.10.25.200
[admin:node-1]: analyticsprofile:client_log_streaming_config> log_types_to_send logs_significant_only
[admin:node-1]: analyticsprofile:client_log_streaming_config> max_logs_per_second 20
[admin:node-1]: analyticsprofile:client_log_streaming_config> save
[admin:node-1]: analyticsprofile> save
+-------------------------------------------------+-------------------------------------------------------+
| Field                                           | Value                                                 |
+-------------------------------------------------+-------------------------------------------------------+
 ...
    Many lines intentionally left out
 ...
| client_log_streaming_config                     |                                                       |
|   external_server                               | 10.10.25.200                                          |
|   external_server_port                          | 514                                                   |
|   log_types_to_send                             | LOGS_SIGNIFICANT_ONLY                                 |
|   max_logs_per_second                           | 20                                                    |
+-------------------------------------------------+-------------------------------------------------------+
[admin:node-1]: >
After making the changes above, traffic logs of any virtual service associated with this analytics profile will be streamed to the configured external server(s).
Multiple External Server CLI Configuration Examples
[admin:10-10-23-81]: > configure analyticsprofile testprofile
[admin:10-10-23-81]: analyticsprofile> client_log_streaming_config external_server 10.0.0.4,10.0.0.5,10.0.0.6:500
[admin:10-10-23-81]: analyticsprofile> save
+-------------------------------------------------+-------------------------------------------------------+
| Field                                           | Value                                                 |
+-------------------------------------------------+-------------------------------------------------------+
| uuid                                            | analyticsprofile-94517d21-9c61-4255-9325-78954caa1d78 |
| name                                            | testprofile                                           |
| tenant_ref                                      | admin                                                 |
|                                                 |                                                       |
|                                   Many lines intentionally left out                                     |
|                                                 |                                                       |
|                                                 |                                                       |
| client_log_streaming_config                     |                                                       |
|   external_server                               | 10.0.0.4,10.0.0.5,10.0.0.6:500                        |
|   external_server_port                          | 514                                                   |
|   protocol                                      | LOG_STREAMING_PROTOCOL_UDP                            |
|   log_types_to_send                             | LOGS_ALL                                              |
|   max_logs_per_second                           | 100                                                   |
| exclude_dns_policy_drop_as_significant          | False                                                 |
| disable_ondemand_metrics                        | False                                                 |
| ondemand_metrics_idle_timeout                   | 1800 seconds                                          |
| sip_log_depth                                   | 20                                                    |
| healthscore_max_server_limit                    | 20                                                    |
| enable_advanced_analytics                       | True                                                  |
| disable_vs_analytics                            | False                                                 |
+-------------------------------------------------+-------------------------------------------------------+
Enabling Application Log Streaming through NSX Advanced Load Balancer UI
Log into the Controller with sufficient administrative privilege to perform the following steps:
Navigate to .
Create a new or select pre-existing analytics profile to edit.
In the Edit Analytics Profile sub-screen, Click Client Log tab.
Scroll down to External Logging section and select the Stream Logs to an External Server check box.
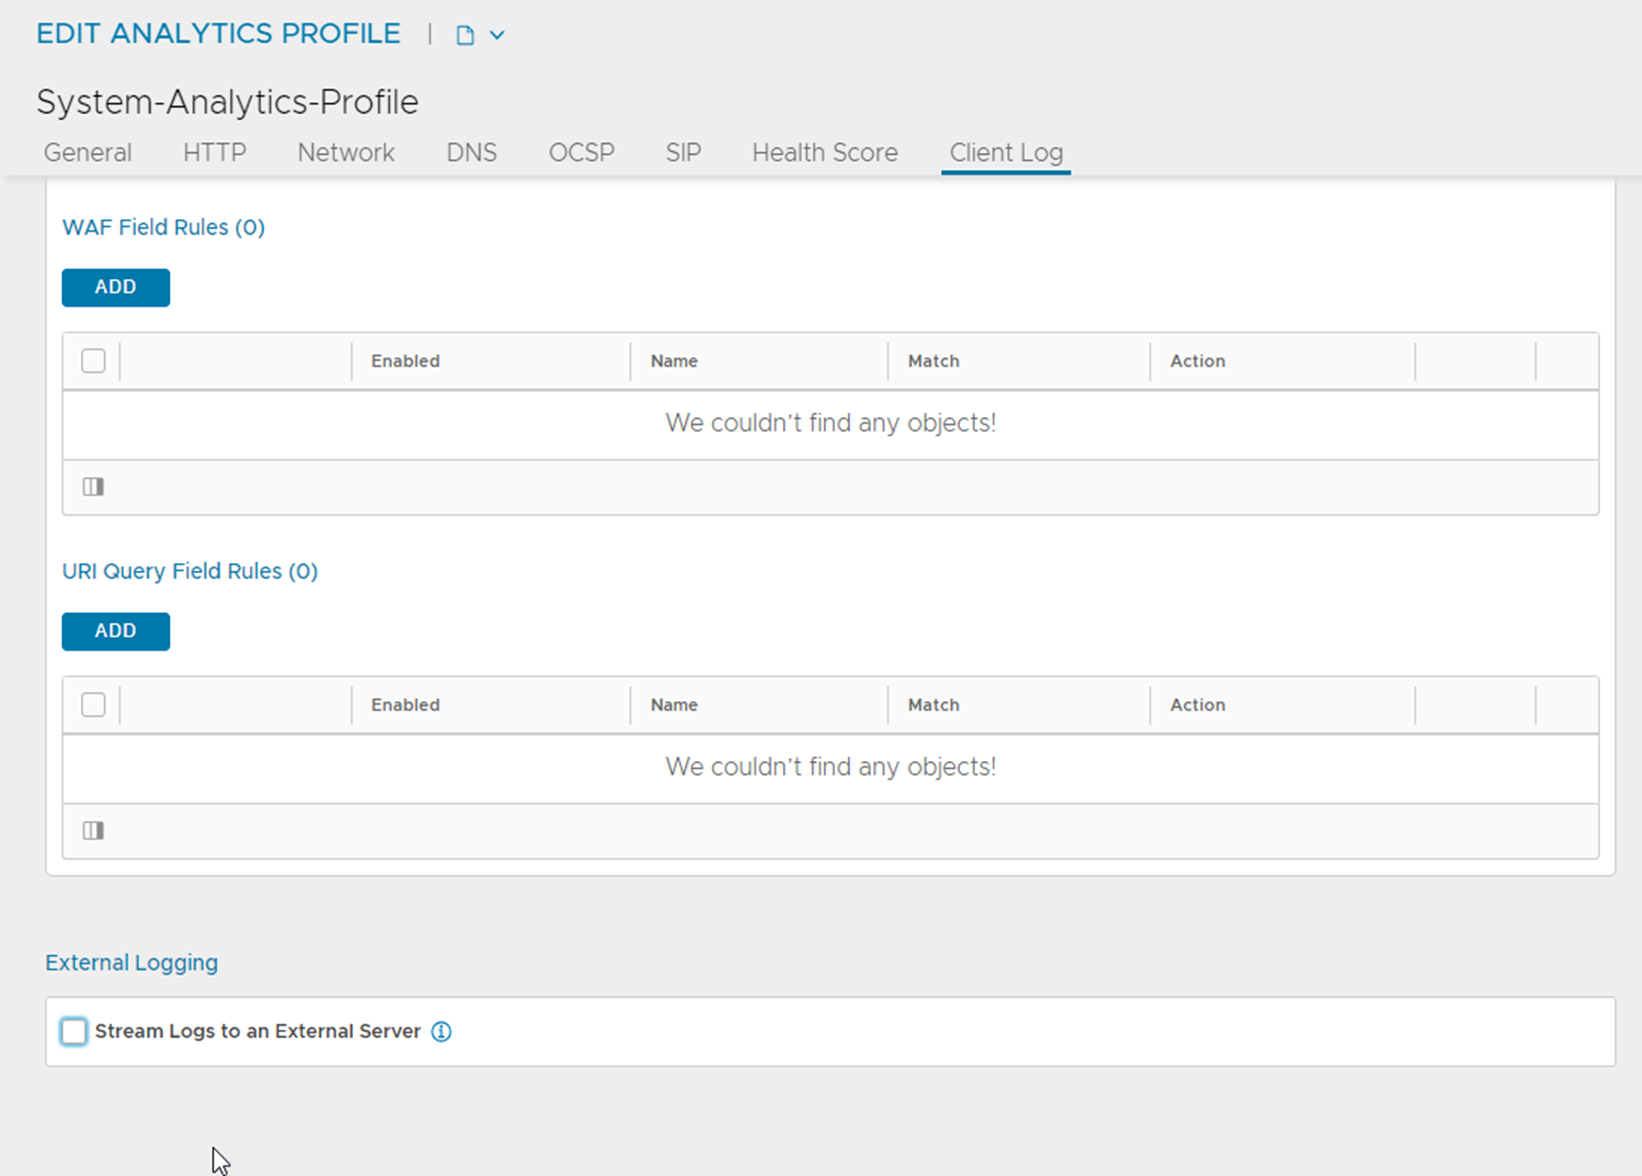
Complete the form, and click Save.
Apply the settings to those virtual services for which log data is to be streamed to the external server.
Rate Limiting
As mentioned above, SEs use their management interface to stream application logs to a configured external server. Since the SE uses the same network interface to synchronize with the NSX Advanced Load Balancer Controller, it is necessary to ensure streaming log traffic does not interfere with the management traffic. To that end, NSX Advanced Load Balancer limits the rate of the streaming traffic to some number of log entries streamed per second. The default limit is 100 log entries per second. Though this rate can be changed in the configuration, one must be mindful that streaming logs consume both SE CPU cycles and bandwidth on the management network.
For more information on log collection and streaming settings, see Log Collection & Streaming Settings.
The se_log_agent can only throttle at the maximum rate of 15k logs/ sec. On our test setup, to achieve the maximum rate of 15k logs/ sec, the log_agent_sleep_interval field was reduced up to 2 MS.
Formatting of the Streamed Messages
By default, each log is streamed as a JSON-formatted string with no line-breaks.
Example layout:
{"adf": 1, "virtualservice": "virtualservice-4abd93ed-9d89-4ca2-813f-f1706285d7c7", "report_timestamp": "2017-05-01T15:10:08.798592", "service_engine": "10.10.25.204", "vcpu_id": 1, "log_id": 5, "client_ip": "10.90.20.11", "client_src_port": 41392, "client_dest_port": 9000, "client_rtt": 1, "http_version": "1.1", "method": "GET", "uri_path": "/notexist.html", "referer": "www.avinetworks.com", "user_agent": "L7ProxyTest", "xff": "192.168.1.1 17.33.22.107 12.124.13.12 109.32.12.34 234.12.23.67", "host": "10.90.20.64:9000", "persistent_session_id": 3472328296917460336, "response_content_type": "text/html", "request_length": 299, "cacheable": 1, "pool": "pool-16fd2f0c-01db-467a-b673-6faa076b9142", "pool_name": "l7pool1", "server_ip": "10.90.20.61", "server_name": "10.90.20.61", "server_conn_src_ip": "10.90.20.13", "server_dest_port": 80, "server_src_port": 49003, "server_rtt": 16, "server_response_length": 1395, "server_response_code": 404, "server_response_time_first_byte": 1, "server_response_time_last_byte": 1, "response_length": 1397, "response_code": 404, "response_time_first_byte": 1, "response_time_last_byte": 1, "compression": NO_COMPRESSION_CAN_BE_COMPRESSED, "client_insights": NO_INSIGHTS_NOT_SAMPLED_TYPE, "request_headers": 689219, "response_headers": 13, "request_state": AVI_HTTP_REQUEST_STATE_SEND_TO_CLIENT, "significant_log": [ADF_RESPONSE_CODE_4XX], "headers_sent_to_server": "X-Forwarded-For: 10.90.20.11 Host: 10.90.20.64:9000 Accept-Encoding: identity Accept: */* User-Agent: L7ProxyTest referer: www.avinetworks.com Authorization: Basic YXZpdXNlcjphdml1c2Vy ", "headers_received_from_server": "Server: nginx/1.2.1 Date: Mon, 01 May 2017 15:15:24 GMT Content-Type: text/html Content-Length: 1242 Connection: keep-alive ", "server_connection_reused": 1, "vs_ip": "10.90.20.64", "body_updated": NOT_UPDATED, "vs_name": "l7vs1"}
Every log contains a field named report_timestamp, that denotes the time at which that log was generated at the corresponding Service Engine.
The available formatting options available are:
JSON formatted single-line message as a UDP datagram - (Default)
JSON formatted single-line message over a TCP connection
JSON formatted single-line message over a TCP connection encrypted with TLS
Syslog (RFC 5424) formatted message as a UDP datagram (log information is still represented in JSON format, but enclosed with Syslog header)
Syslog (RFC 5424) formatted message over a TCP connection
Syslog (RFC 5424) formatted message over a TCP connection encrypted with TLS -
Currently, the formatting option can only be changed using the CLI.
Selecting Fields for Log Streaming
Users can select particular fields to be included in streamed logs, potentially reducing each streamed log's size significantly. Note that fields chosen must be at the top level of the client logs.
This feature is supported in the NSX Advanced Load Balancer REST API and NSX Advanced Load Balancer CLI but not the NSX Advanced Load Balancer UI.
For example, to stream only the client_ip, uri_path, and the response_code fields, either create a new analytics profile or update an existing one and attach it to the virtual service whose logs are being streamed. An NSX Advanced Load Balancer CLI example follows. The place setting X.X.X.X needs to be set to the IP address of the external server.
[admin:10-10-23-81]: > create analyticsprofile selected-fields-profile
[admin:10-10-23-81]: analyticsprofile> client_log_streaming_config
[admin:10-10-23-81]: analyticsprofile:client_log_streaming_config> external_server X.X.X.X
[admin:10-10-23-81]: analyticsprofile:client_log_streaming_config format_config
[admin:10-10-23-81]: analyticsprofile:client_log_streaming_config> format log_streaming_format_json_selected
[admin:10-10-23-81]: analyticsprofile:client_log_streaming_config> included_fields uri_path
[admin:10-10-23-81]: analyticsprofile:client_log_streaming_config> included_fields client_ip
[admin:10-10-23-81]: analyticsprofile:client_log_streaming_config> included_fields response_code
[admin:10-10-23-81]: analyticsprofile:client_log_streaming_config> save
[admin:10-10-23-81]: analyticsprofile> save
[admin:10-10-23-81]: save
After applying this analytics profile, the streamed log would contain information only for the three selected fields. As an example, the information might appear as follows: {"client_ip":"10.10.22.190","uri_path":"/not_exist","response_code":404}
For a full list of top-level fields, substitute an FQDN or IP address for AVI-CONTROLLER and
For HTTP applications, point your browser to
https://AVI-CONTROLLER/api/analytics/logs#HTTPLogFor non-HTTP services, point your browser to
https://AVI-CONTROLLER/api/analytics/logs#L4Log
Changing streaming format through NSX Advanced Load Balancer CLI
Create a new AnalyticsProfile object or edit an existing one and set the protocol field under the client_log_streaming_config subsection for streaming application logs to one of the following options:
log_streaming_protocol_udp: Stream logs as UDP datagrams.log_streaming_protocol_tcp: Stream logs over a TCP connection.log_streaming_protocol_tls: Stream logs over a TCP connection encrypted with TLS.log_streaming_protocol_syslog_over_tcp: Stream logs using Syslog protocol (RFC5424) with TCP as the transport protocol.log_streaming_protocol_syslog_over_tls: Stream logs using Syslog protocol (RFC5424) with TCP as the transport protocol encrypted with TLS.log_streaming_protocol_syslog_over_udp: Stream logs using Syslog protocol (RFC5424) with UDP as the transport protocol.
[admin:node-1]: > configure analyticsprofile streaming-profile
    [admin:node-1]: analyticsprofile> client_log_streaming_config
    [admin:node-1]: analyticsprofile:client_log_streaming_config> protocol log_streaming_protocol_syslog_over_tcp
    [admin:node-1]: analyticsprofile:client_log_streaming_config> save
    [admin:node-1]: analyticsprofile> save
Customizable Fields When Streaming in SYSLOG Format
These fields may be customized when streaming in syslog format, either over UDP or TCP:
facility— The facility value, as defined in RFC5424. Must be between 0 and 23 inclusive; default is 16.significant_log_severity— The severity code, as defined in RFC5424, for significant logs. Must be between 0 and 7 inclusive; default is 4.filtered_log_severity— The severity code, as defined in RFC5424, for filtered logs. Must be between 0 and 7 inclusive; default is 5.non_significant_log_severity— The severity code, as defined in RFC5424, for non-significant logs. Must be between 0 and 7 inclusive; default is 6.hostname— The string to use as the hostname in the syslog messages. This string can contain only printable ASCII characters (hex 21 to hex 7E; no spaces allowed). String length is 255; default is NSX Advanced Load Balancer.
These fields are available under the syslog_config field under client_log_streaming_config.
[admin:node-1]: > configure analyticsprofile streaming-profile
[admin:node-1]: analyticsprofile> client_log_streaming_config
[admin:node-1]: analyticsprofile:client_log_streaming_config> syslog_config
[admin:node-1]: analyticsprofile:client_log_streaming_config:syslog_config> hostname Avi-18.1.3-New
[admin:node-1]: analyticsprofile:client_log_streaming_config:syslog_config> save
[admin:node-1]: analyticsprofile:client_log_streaming_config> save
[admin:node-1]: analyticsprofile> save
Streaming Client Logs Directly Without Writing Data to Local or Network Disk
By default, any log (significant, filtered, or non-significant) collected on Services Engines is saved to disk so that the NSX Advanced Load Balancer Controller can retrieve them and process them on demand. However, when all logs are streamed from SEs to an external system, and no processing by the NSX Advanced Load Balancer Controller is desired, saving all logs to disk unnecessarily wastes IO bandwidth. local- or network-disk logging can be turned off by using either the NSX Advanced Load Balancer UI or NSX Advanced Load Balancer CLI, as indicated below.
Using the NSX Advanced Load Balancer UI
Depicted below are two views of the Client Log Configuration section of the Application Profile editor. In addition to selecting the Stream Logs to an External Server check box, the user can independently select the behavior desired for significant, filtered, and non-significant logs.
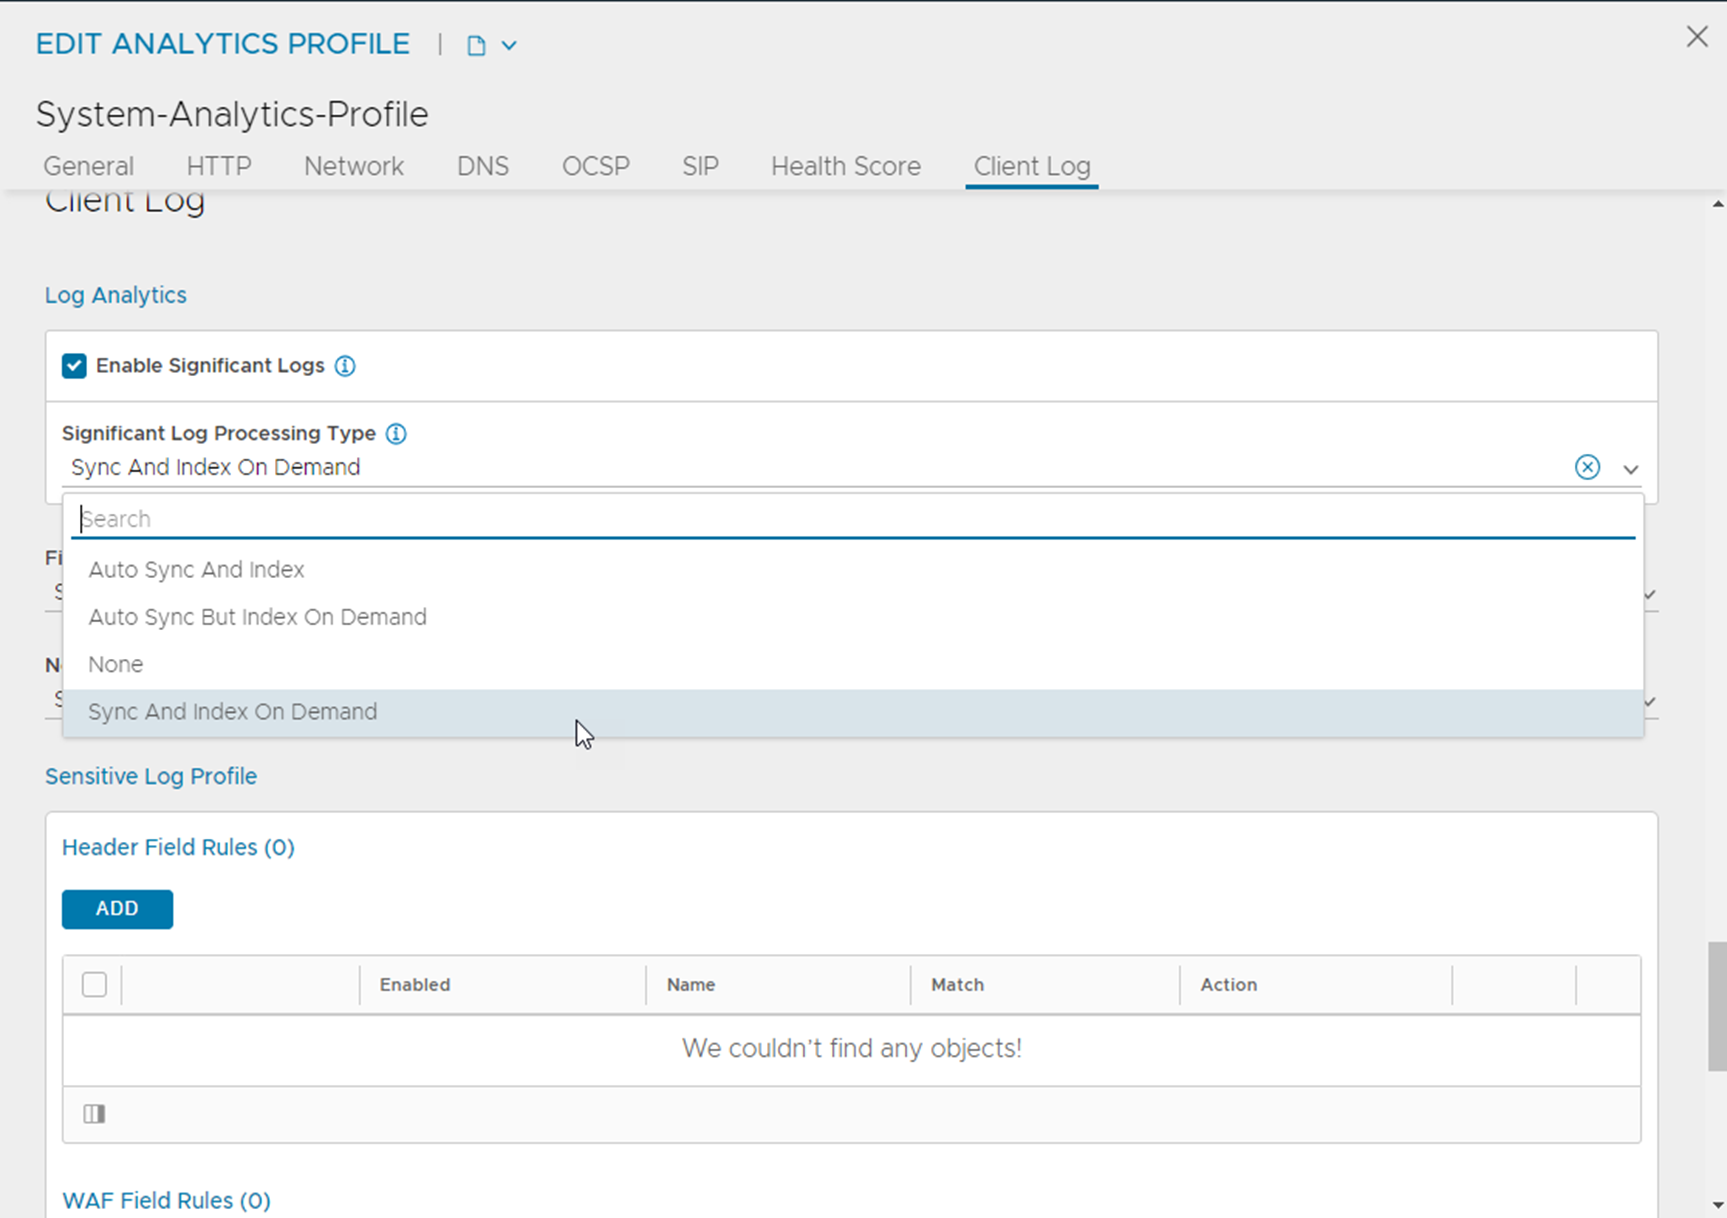
Select None to turn off writing log data to local or network disk.
Using the NSX Advanced Load Balancer CLI
Parameters under the client_log_config field in the Analytics Profile need to be set to LOG_PROCESSING_NONE. Those parameters are significant_log_processing, filtered_log_processing, and non_significant_log_processing.
IPv6 Support for Streaming Client Logs
Starting with version 22.1.3, the NSX Advanced Load Balancer supports Service Engine to external log server communication over IPv6. With this, you can provide an IPv6 external server under the analytics profile. The analytics profile can have an external server configured with an IPv6 address or IPv6 address along with a port. While passing the IP:PORT as an external server, the IPv6 address must be enclosed in brackets. A comma-separated list could be passed as external servers if you want more than one external server. Consider the following example:
external_server 23.12.12.4,2001:123::1 or
external_server 12.12.12.12:343,[2001:123::1]:234
[admin:10-79-175-173]: > configure analyticsprofile ipv6-streaming
[admin:10-79-175-173]: analyticsprofile> client_log_streaming_config
[admin:10-79-175-173]: analyticsprofile:client_log_streaming_config> external_server
external_server        IP address or hostnames (FQDNs) of destination servers...
external_server_port   The service port to use for the external servers. If m...
[admin:10-79-175-173]: analyticsprofile:client_log_streaming_config> external_server 23.12.12.4,2001:123::1.
[admin:10-79-175-173]: analyticsprofile:client_log_streaming_config> where
Tenant: admin
Cloud: Default-Cloud
+-----------------+-------------------------+
| Field           | Value                   |
+-----------------+-------------------------+
| external_server | 23.12.12.4,2001:123::1. |
+-----------------+-------------------------+
[admin:10-79-175-173]: analyticsprofile:client_log_streaming_config> save
[admin:10-79-175-173]: analyticsprofile> save
The IPv6 external server under the analytics profile is as shown below:

Splunk as the External Server
Splunk can be configured to receive UDP messages on port 514.
For more information, see Splunk documentation.
./splunk add udp 514 -sourcetype syslog
We recommend using syslog as the source type to properly interpret the single-line JSON string streamed for each log.
By default, Splunk would timestamp each received log with a timestamp corresponding to the time at which Splunk received that log.
To force Splunk to use the report_timestamp in the log content as the timestamp for the log, set the following configuration in props.conf:
[syslog]
TIME_PREFIX = \"report_timestamp\":\ \"
TIME_FORMAT = %Y-%m-%dT%H:%M:%S.%5N
For more information, see documentation.
Screenshot from a Splunk Server:

