


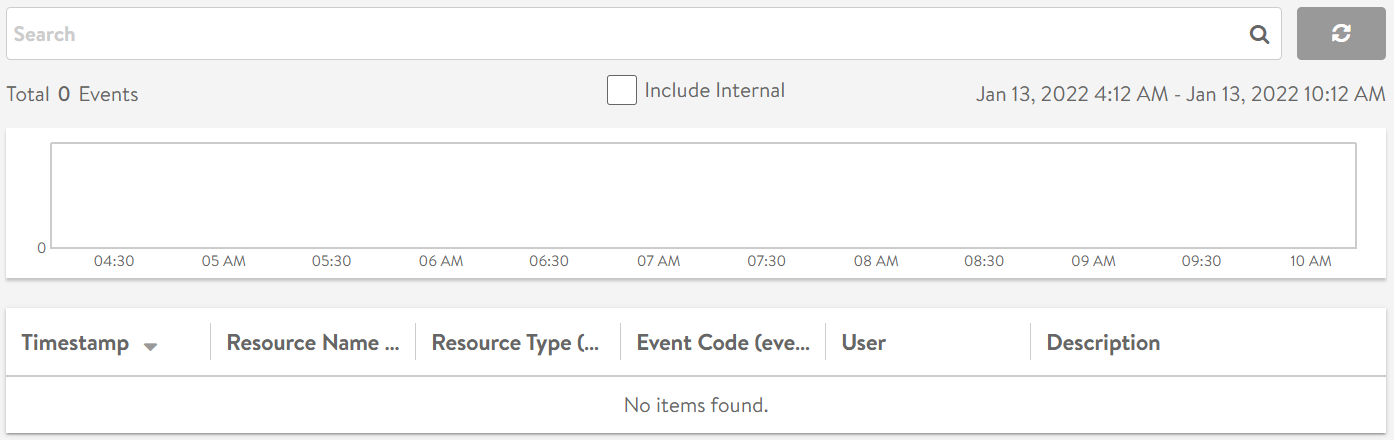
The Events tab presents system-generated events over the time period selected for the pool.
System events apply to the context in which you are viewing them. For instance, when viewing events for a pool, only events that are relevant to that pool are displayed.
The following fields are available in this screen:
Field |
Description |
|---|---|
Search |
The search field enables you to filter the events using whole words contained within the individual events. |
Refresh |
Clicking on refresh updates the events displayed for the currently selected time. |
Include Internal |
By default, several events are not shown here as they tend to be noisy and less relevant for general purpose. Enable this option to troubleshoot for esoteric issues. |
Include System Events |
System generated configuration events are displayed by default. To exclude system generated configuration events, deselect the Include System Events check box. |
Number |
The total number of events being displayed. The date/time range of those events appears beneath the search field on the left. |
Clear Selected |
If filters have been added to the Search field, clicking the Clear Selected (X) icon on the right side of the search bar will remove those filters. Each active search filter will also contain an X that you can click to remove the specific filter. |
Histogram |
The histogram shows the number of events over the period of time selected. The X-axis is time, while the Y-axis is the number of events during that bar’s period of time.
|
Field |
Description |
|---|---|
Timestamp |
Date and time the event occurred. Highlighting a section of the histogram provides further filtering of events within a smaller time window. |
Event Type |
This may be one of the following:
|
Resource Name |
Name of the object related to the event, such as the pool, virtual service, Service Engine, or Controller. |
Event Code |
A short event definition, such as Config_Action or Server_Down. |
Description |
A complete event definition. For configuration events, the description will also show the user that made the change. |
Expand/Contract |
Clicking the plus (+) or minus sign (-) for an event log either expands or contracts that event log. Clicking the + and – icons in the table header expands and collapses all entries in this tab. |
New fields will appear highlighted in green in the new configuration.
Removed fields will appear highlighted in red.
Changed fields will show highlighted in yellow.
