


The Health tab presents a detailed breakdown of health score information for the pool.
The health score is displayed as follows:
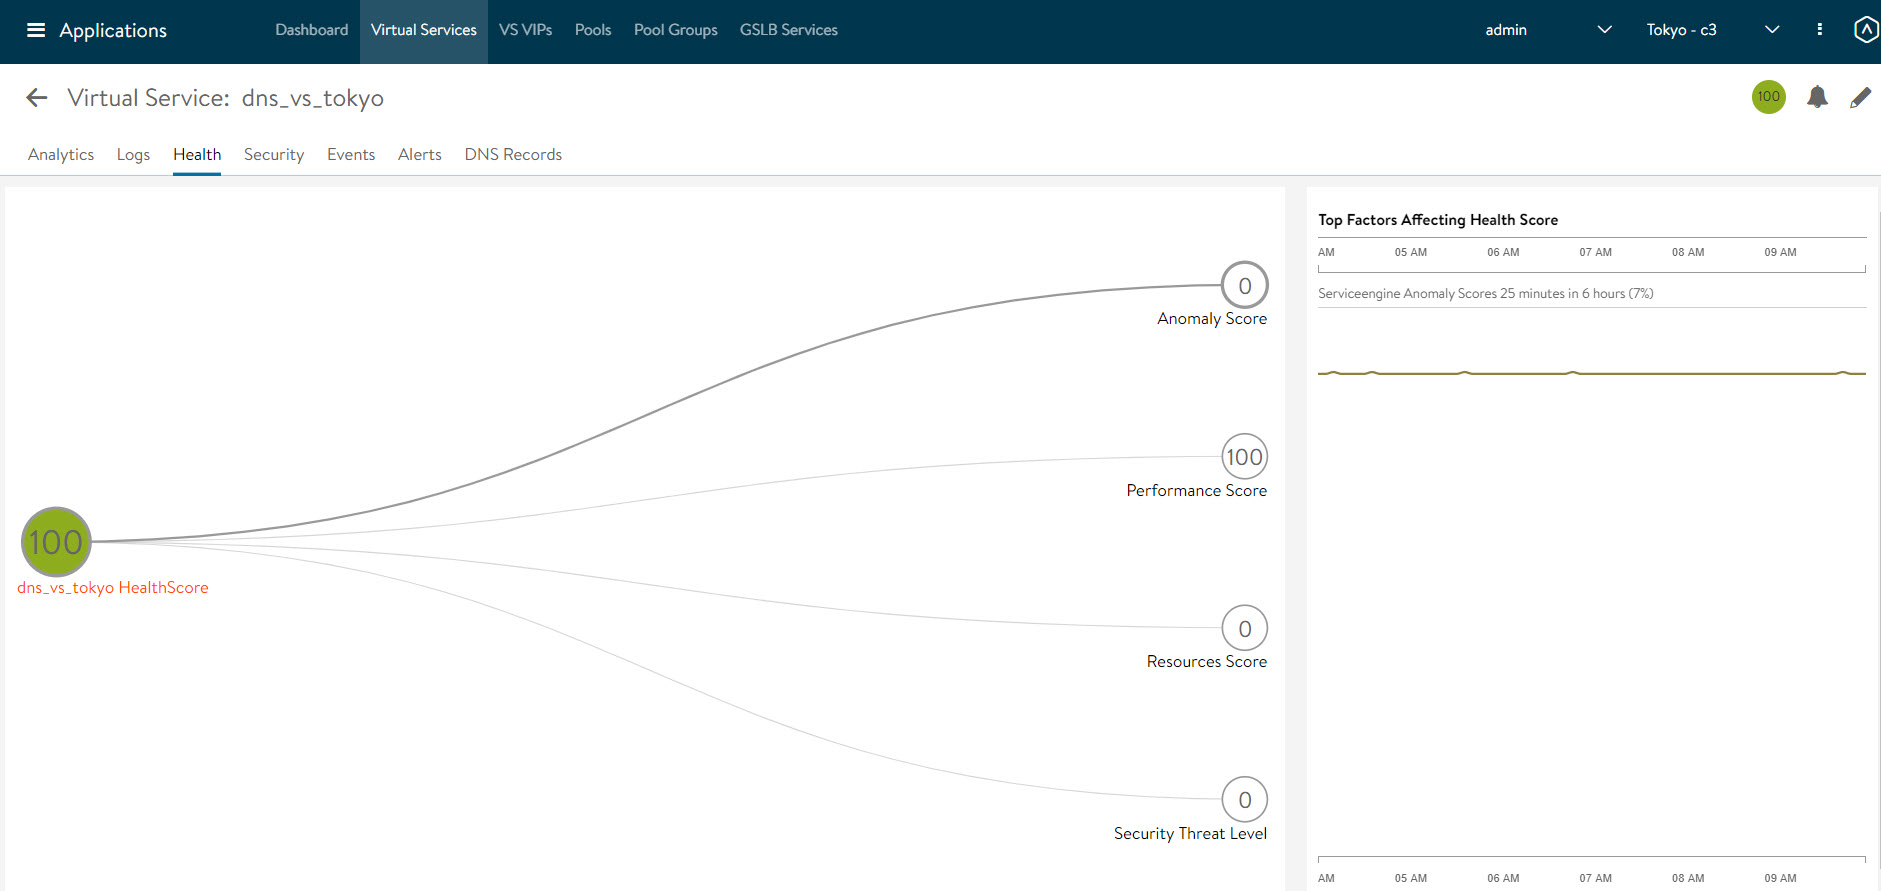
The health score of a pool is comprised of the following scores:
Field |
Description |
|---|---|
Performance Score |
Performance score (1-100) for the selected item. A score of 100 is ideal, meaning clients are not receiving errors and connections or requests are quickly returned. |
Resources Score |
Any score assessed because of resource availability issues is assigned a score, which is then subtracted from the performance score. A penalty score of 0 is ideal, meaning there are no obvious resource constraints on NSX Advanced Load Balancer or servers. |
Anomaly Score |
Any score assessed because of anomalous events is assigned a score, which is then subtracted from the performance score. An ideal score is 0, which means NSX Advanced Load Balancer has not seen recent anomalous traffic patterns that may imply future risk to the site. |
Health Score |
The final health score for the selected item equals the performance score minus the Resource and anomaly penalty scores |
This will display more sub-metrics which feed into the top-level metric/tile selected. Hover the mouse over a time period in the main chart to see the description of the score degradation. Some tiles may have more information shown in the main chart section that requires scrolling down to view.
