


The VMware NSX Advanced Load Balancer relies extensively on analytics throughout the system to determine the health of applications based on expectations of what a typical user experience must be.
Since each application is different, it might be necessary to modify the analytics profile to set the threshold for satisfactory client experience or omit certain errors from being counted against the application health, such as prompting a user to log in to a site through an HTTP 401 response code.
Profile Settings
The following options are available within the analytics profile.
General
HTTP Analytics
Network Analytics
DNS
OCSP
SIP
Health Score Analytics
Client Log
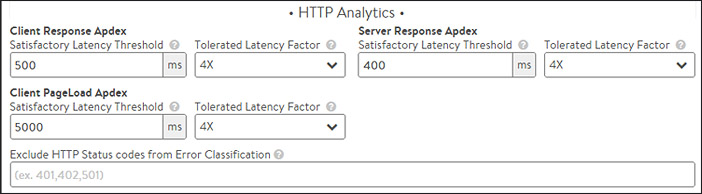
HTTP Analytics
These settings will only be applied to virtual services configured with an HTTP application profile. For non-HTTP virtual services, these HTTP settings will have no effect.
The concept of Apdex is used extensively by VMware NSX Advanced Load Balancer to capture a client’s experience when accessing a virtual service. Apdex is an industry standard for rating a user’s experience as satisfied, tolerated, or frustrated.
The results are used as part of the performance metric of the pool and virtual service health score. The greater the number of satisfied responses, the higher the score. For more information, see www.apdex.org.
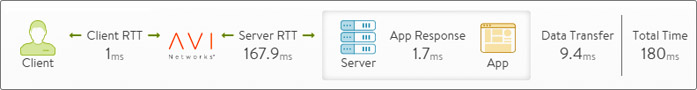
Client Satisfactory Latency Threshold
A client must receive a completed response to an HTTP request within this time frame to be considered satisfied with the transaction time. Using the default of 500 ms, any response that is complete with 0-500 ms is considered satisfactory. A response time is measured through the End to End Timing’s Total Time metric, which includes Client RTT, Server RTT, App Response, and the Data Transfer metrics.
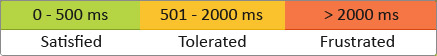
Client Tolerated Latency Factor
The Client Satisfied Latency Threshold is multiplied by the Tolerated Factor to determine the tolerated threshold. If Client Satisfied Latency Threshold is 500 ms and Client Tolerated Latency Factor is 4x, 0-500ms is satisfied, while 500 ms to 2000 ms is considered a tolerated response time and anything over 2000 ms is considered frustrated.
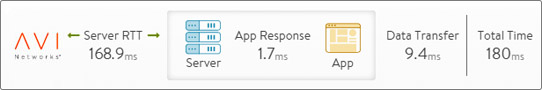
Server Satisfactory Latency Threshold
This is same as Client Satisfactory Latency Threshold. However, this metric takes the client’s latency out of the picture by only measuring Server RTT, App Response, and the Data Transfer time between the server and the Service Engine. This is similar to viewing the End to End Timing of a pool rather than a virtual service. This metric helps differentiate between poor response times due to slow servers versus slow clients.
Server Tolerated Latency Factor
Similar to Client Tolerated Latency Factor, this option multiplies the Server Satisfactory Latency Threshold to determine tolerated responses from servers.
Client PageLoad Satisfactory Latency Threshold
Similar to Client Satisfactory Latency Threshold, this metric looks at PageLoad times rather than a single HTTP request. PageLoad requires the HTTP virtual service to have the analytics type set to active, which will insert JavaScript into a sampling of HTTP responses. PageLoad measures the time it takes for a client to download an entire web page, which might include many objects. It also includes the time for DNS lookups, TCP connection setup, object download, and page rendering. For example, the VMware NSX Advanced Load Balancer might see satisfied file transfers for objects it is serving, even though clients are viewing errors due to third-party HTML files being slow or having JavaScript errors. This metric is intended catch these issues and incorporate them into the health score.
This metric will catch the following issues.
Client PageLoad Tolerated Latency Factor
Similar to Client Tolerated Latency Factor, this field is used to determine clients using PageLoad that are having a tolerated or frustrated experience.
Exclude HTTP Status Codes from Error Classification
By default any
4xxand5xxresponses are considered errors. The greater the percentage of errors, the more the performance health score metric is lowered. Errors are also logged through the significant client logs. Some of these errors might need to be excluded for certain applications. For example, SharePoint will send a401error to clients, asking them to first authenticate before accessing the website.
Network Analytics
Some errors might not be abnormal for a given environment. Excluding these issues from the list of errors ensures that they will not degrade health score or generate logs.
Client Connection RST
A graceful TCP shutdown occurs through a FIN/ACK process. The VMware NSX Advanced Load Balancer records RST packets as an error unless otherwise excluded.
Client Connection Persistence Changed
Connection persistence change is typically due to a server going offline, forcing VMware NSX Advanced Load Balancer to rebalance connections to new servers. Selecting this option excludes this scenario from the list of errors.
Client Connection Close before HTTP Request
If the client closes the connection prior to completing an HTTP request, the VMware NSX Advanced Load Balancer will record this as an error. Selecting this option excludes this scenario from the list of errors.
Server Connection RST
A graceful TCP shutdown normally occurs via a FIN/ACK process. The VMware NSX Advanced Load Balancer records RST packets as an error unless otherwise excluded. Applications such as Microsoft Exchange might use RST to close connections. Selecting this option will omit server RSTs from the list of errors.
Interruptions to TCP connections can happen for many reasons. These connections are deemed lossy and are logged through the significant client logs. They can also reduce the performance health score metric. These metrics are applicable for any virtual service using TCP in proxy mode. Lossy connections can happen on the client or server side of the VMware NSX Advanced Load Balancer. Their influence on health scores can be adjusted below.
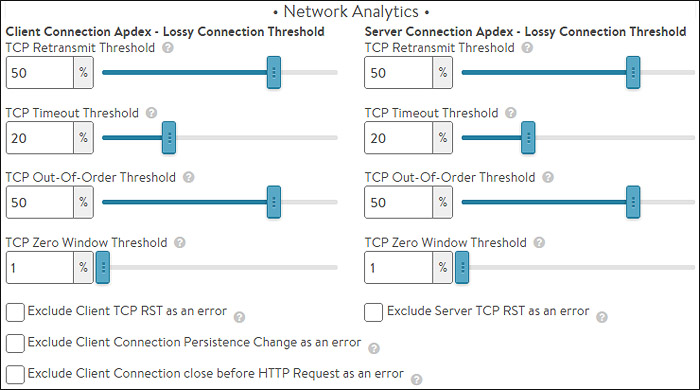
TCP Retransmit Threshold
The TCP connection is considered lossy when more than this percent of packets are retransmitted.
TCP Timeout Threshold
Similar to the previous metric, this option specifically evaluates the number of retransmissions that were required due to timeouts.
TCP Out-of-Order Threshold
The connection is deemed lossy when more than this percentage of packets received from the client are out of order.
TCP Zero Window Threshold
The connection is deemed lossy when greater than this percentage of packets could not be transmitted because the TCP connection window had reduced to zero.
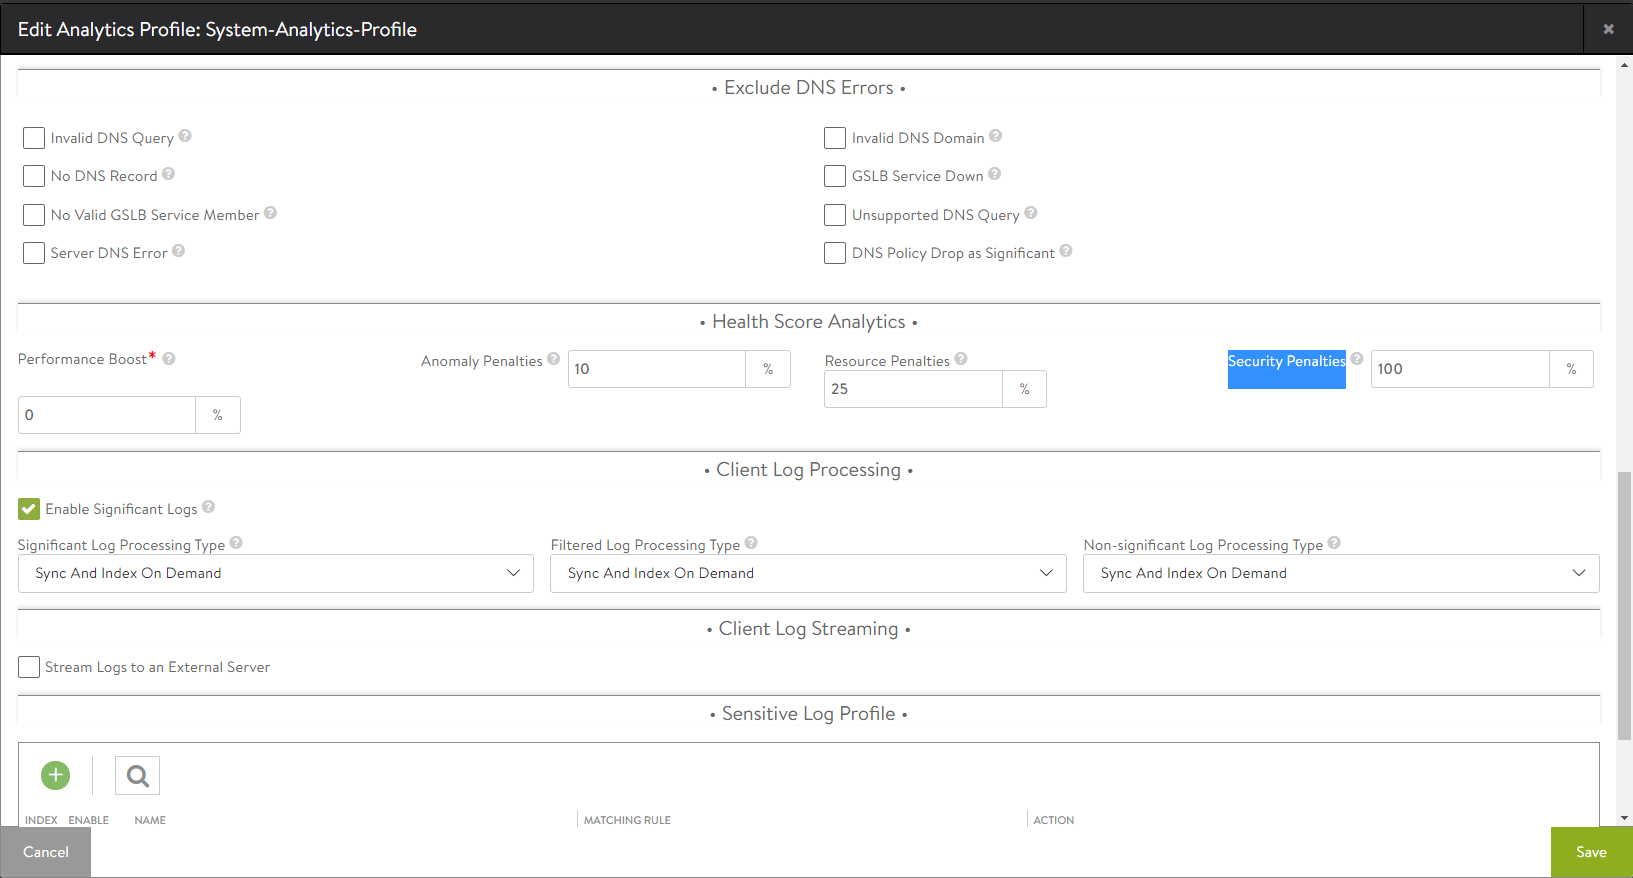
DNS
You can exclude certain DNS errors from the list of errors. Select the appropriate check boxes from the following list.
Invalid DNS Query
Select this check box to exclude DNS query from the list of errors.
No DNS Record
Select this check box to exclude queries to domains that did not have configured services/records from the list of errors.
No Valid GSLB Service Member
Select this check box to exclude queries to GSLB services that have no available members from the list of errors.
Server DNS Error
Select this check box to exclude server DNS error response from the list of errors.
Invalid DNS Domain
Select this check box to exclude DNS queries to domains outside the domains configured in the DNS application profile from the list of errors.
GSLB Service Down
Select this check box to exclude queries to GSLB services that are operationally down from the list of errors.
Unsupported DNS Query
Select this check box to exclude unsupported DNS queries from the list of errors.
DNS Policy Drop as Significant
Select this check box to exclude DNS policy drops from the list of errors.
SIP Profile
The number of Session Initiation Protocol (SIP) messages logged per SIP transaction and which error codes to ignore in a SIP transaction are configurable.
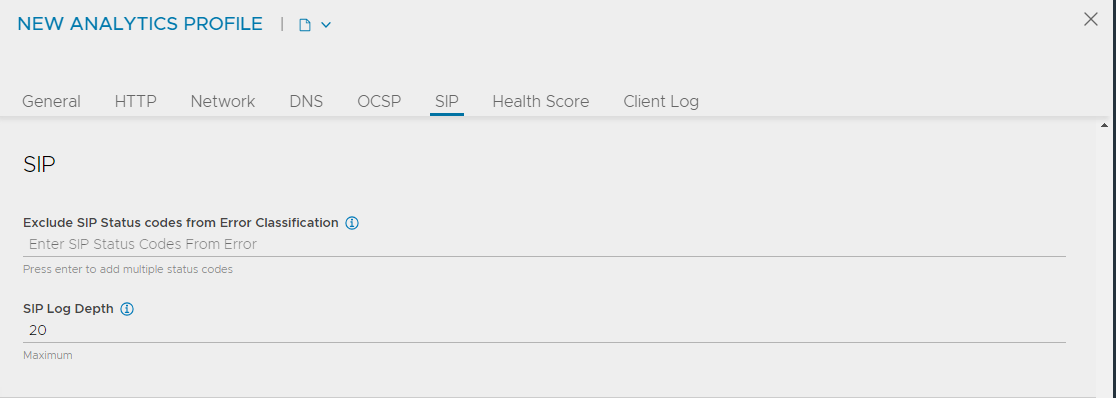
Exclude SIP Status codes from Error Classification
Specify the list of SIP status codes to be excluded from being classified.
SIP log depth
Specify the SIP log to indicate the maximum number of SIP messages added in logs for a SIP transaction.
Health Score Analytics
Health scores are assigned to servers, pools, virtual services, and Service Engines. The following settings specifically apply to modifying the health scores of virtual services, whose scores are comprised of performance, anomaly, and resource penalties.
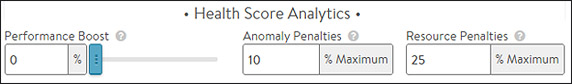
Performance Boost
Some applications might not be able to consistently meet a response Apdex threshold. For example, an application that relies on a backend database might normally respond within 50 ms, but occasional DB queries can take 2 seconds. Set the tolerated client and server response Apdex thresholds greater than 2 seconds. This allows the satisfied threshold to remain aggressive while still allowing occasional slow responses.
Anomaly Penalties
This setting controls the points that anomalies will deduct from the performance score. Anomalies represent risk to the application through inconsistent behavior of clients, traffic volume, or server responses. Lowering the anomaly penalty places greater emphasis on the performance score and resource penalties.
Resource Penalties
Resources that are constrained will increase the resource penalty score. Examples include the CPU, memory, or disk utilization of a Service Engine or a server running on a virtual machine.
Security Penalties
Specify the maximum penalty that may be deducted from health score based on security assessment.
Client Log
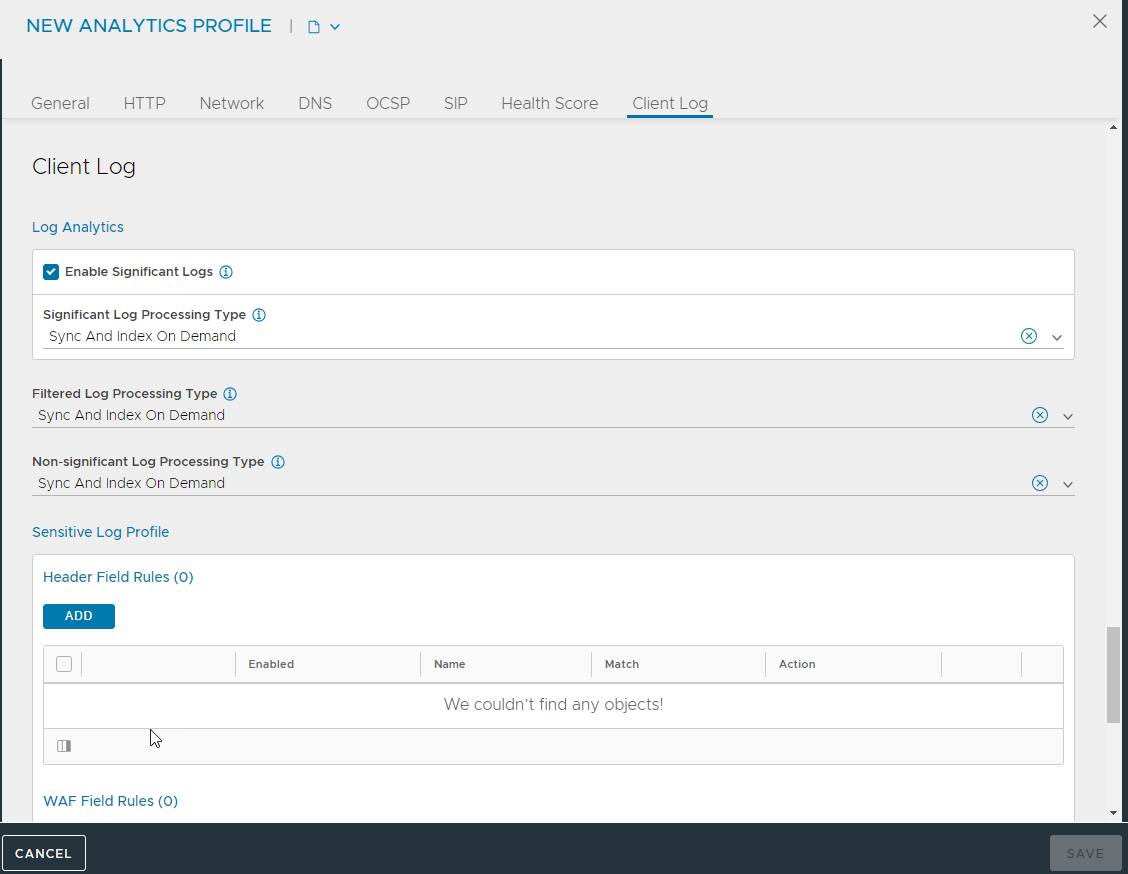
Enable Significant Logs
Select this check box to enable significant log collection. By default, this field is enabled, which means that the SEs collect significant logs and forward them to Controller for further processing. For example, these logs correspond to error conditions such as when the response code for a request is 500. You can deactivate this field to turn off default significant log collection.
Significant Log Processing Type
Select the significant log processing type from the drop-down menu. The significant logs are processed by the Log Analytics system according to this setting. The following are the options in drop-down menu.
Auto Sync and Index
Auto Sync But Index on Demand
None
Sync and Index on Demand
Filtered Log Processing Type
Select the filtered logs processing type from the drop-down menu. Filtered logs are logs that match any client log filers or rules with logging enabled. Such logs are processed by the Logs Analytics system according to these settings. The following are the options in drop-down menu:
Auto Sync and Index
Auto Sync But Index on Demand
None
Sync and Index on Demand
Non-significant Log Processing Type
Select non-significant log processing type from the drop-down menu. Logs that are neither significant nor filtered are processed by the Logs analytics system according to this setting. The following are the options in drop-down menu:
Auto Sync and Index
Auto Sync But Index on Demand
None
Sync and Index on Demand
Sensitive Log Profile
Create a sensitive log profile as shown in the following section.
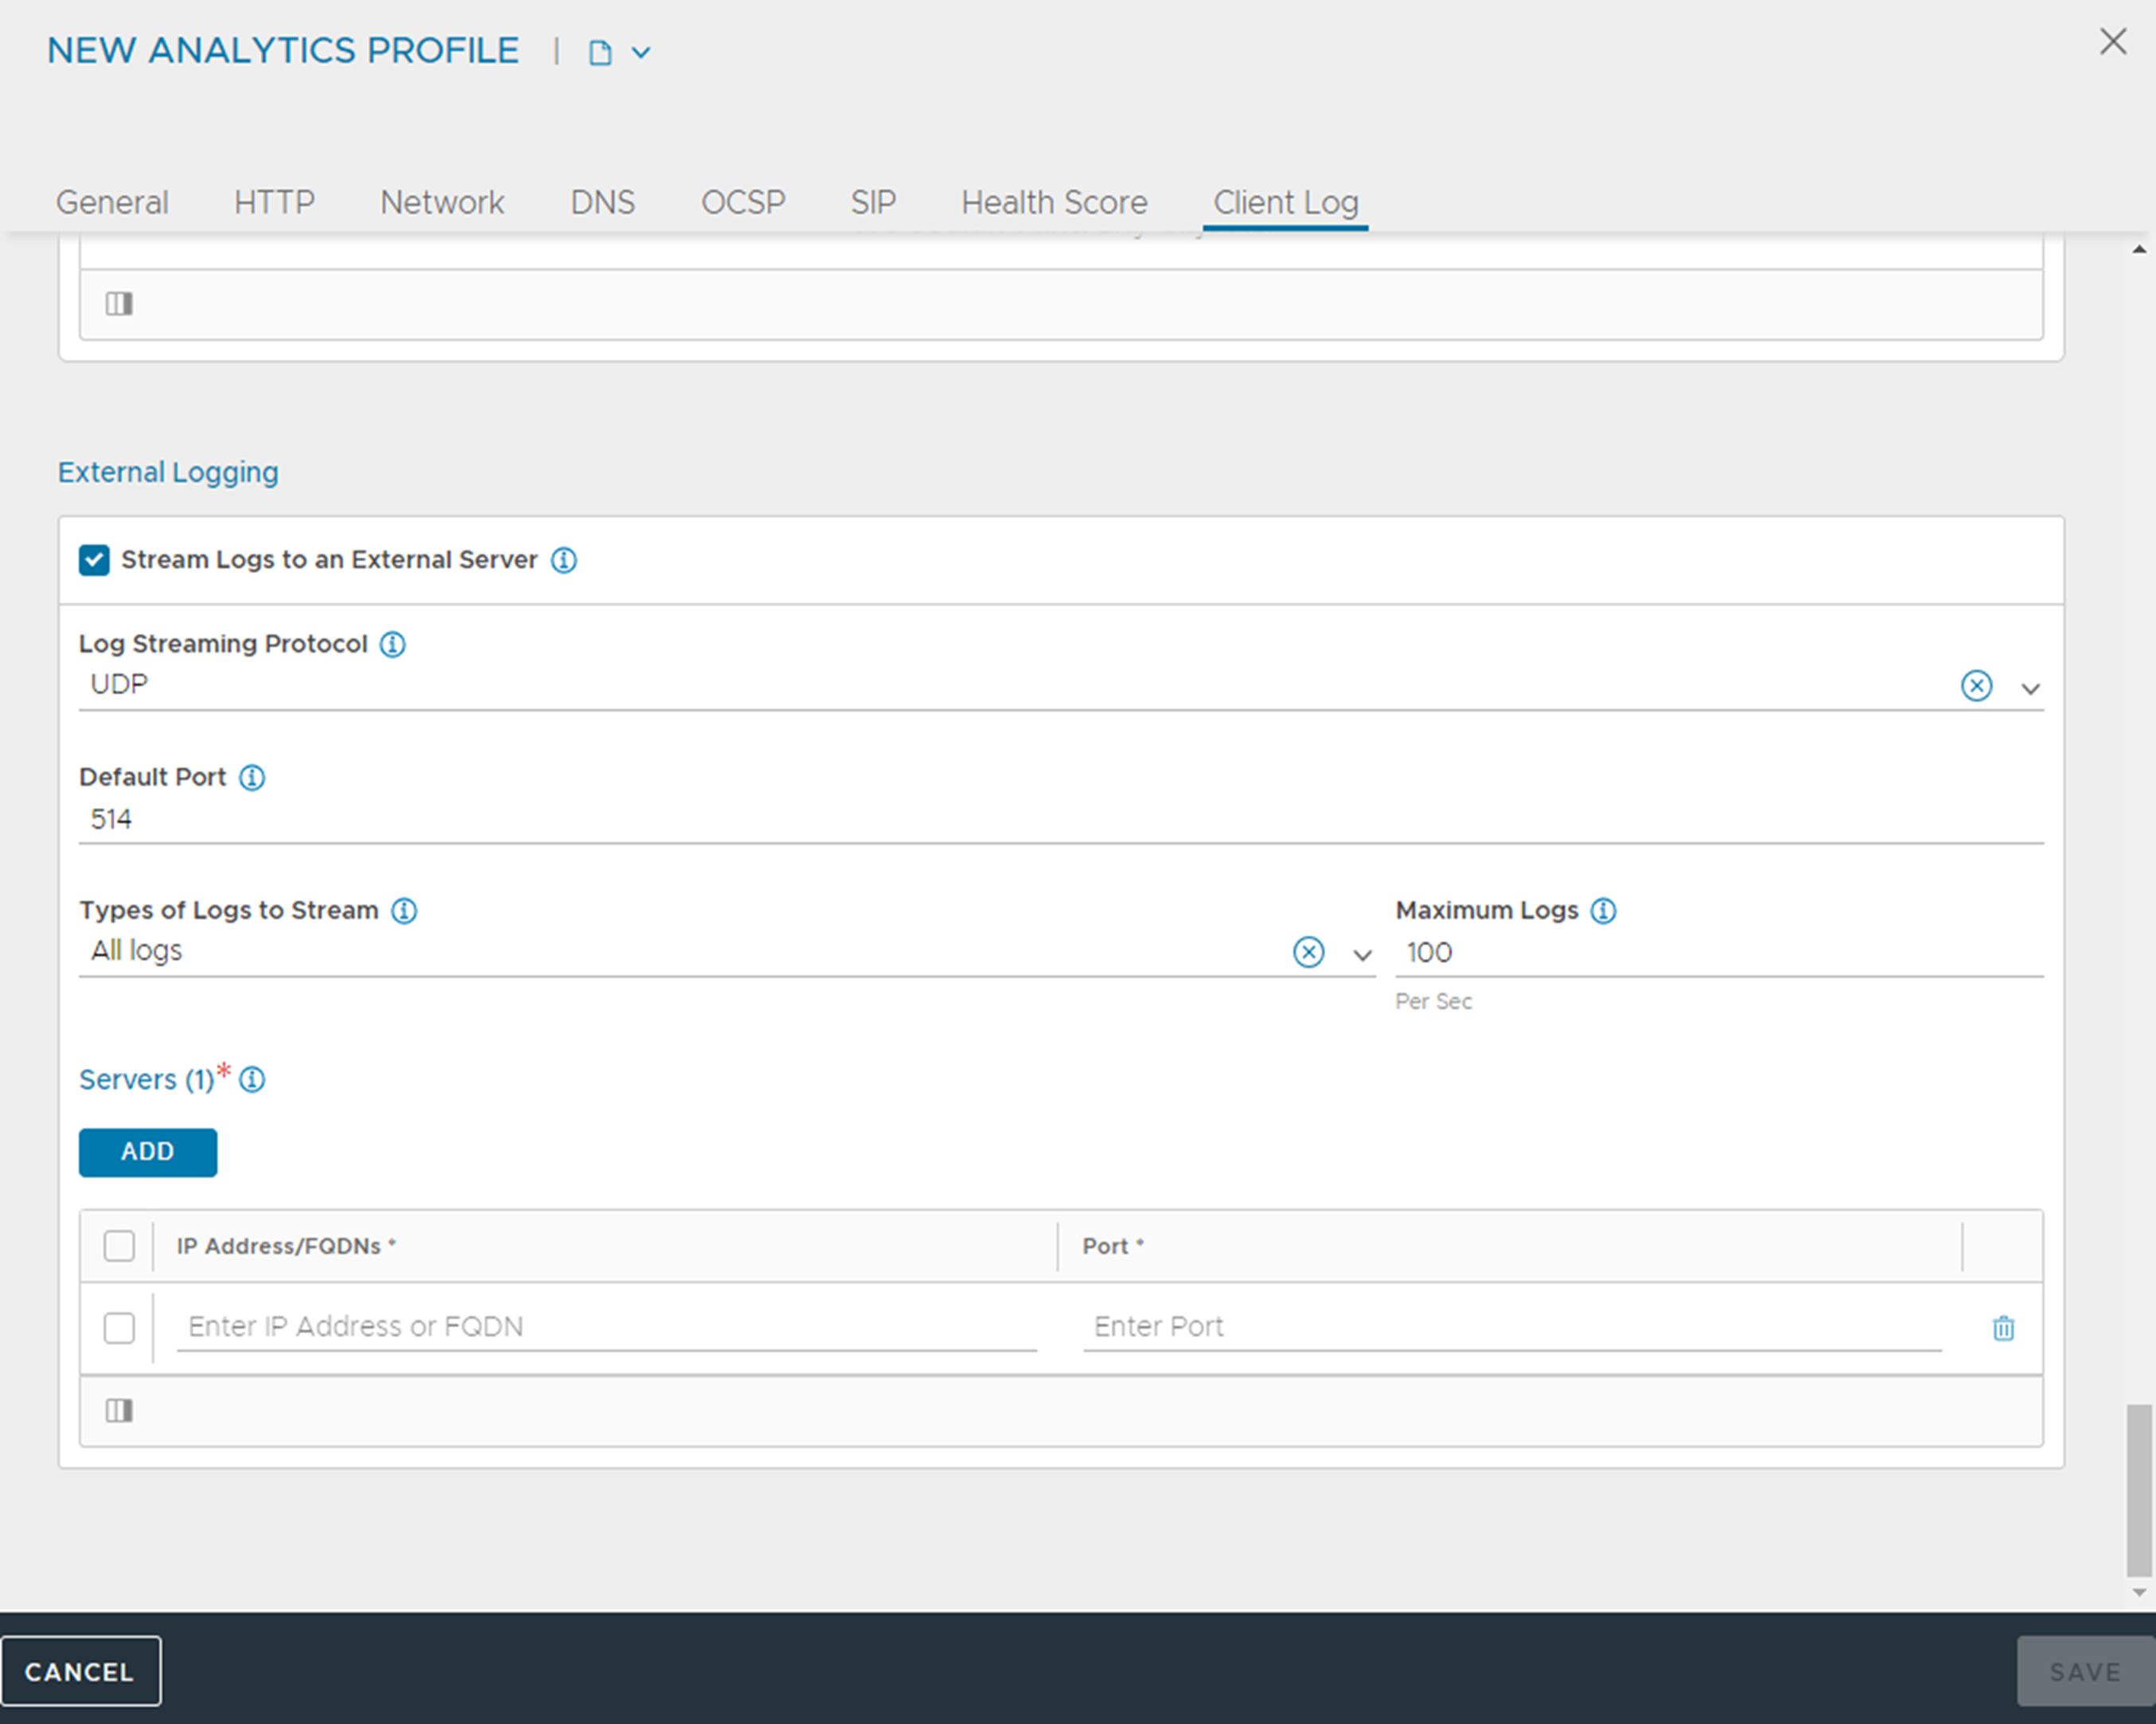
External Logging
Select Stream Logs to an External Server to display the following fields:
Sensitive Log Profile
You can create sensitive log profile by clicking ADD button in the Client Log tab. The following window is displayed:
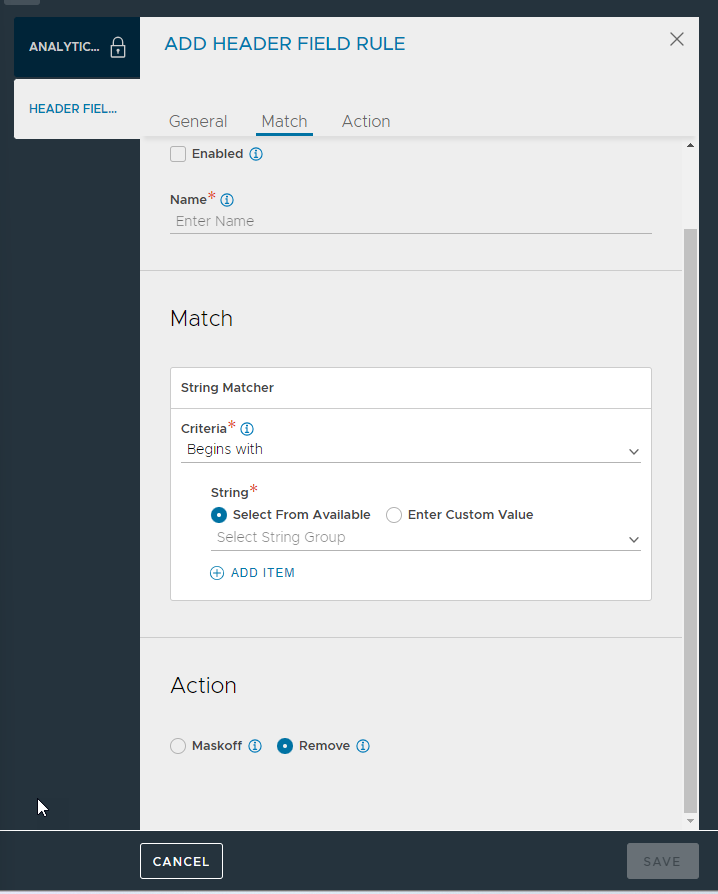
Specify the following details:
Name
Specify the name of the rule.
Match
Select the criterion to use for matching in the log.
Criteria
Select the criteria from the drop-down menu. The list displays the following values:
Begins with
Contains
Does not begin with
Does not contain
Does not end with
Does not equal
Ends with
Equals
Regex pattern does not match
Regex pattern matches
String
Select the string group from the drop-down menu. You can either set the custom value by selecting Enter Custom Value or select the existing values by choosing Select From Available. The list displays the following values:
System-BotCloudProviders
System-BotSearchEngines
System-Cacheable-Resource-Types
System-Compressible-Content-Types
System-Devices-Mobile
System-Rewritable-Content-Types
You can add multiple string group or custom string by clicking ADD ITEMoption.
Action
Select the action for the matched log field, for example, the matched field can be removed or masked off.
