


This section describes the details of health monitors used by NSX Advanced Load Balancer. NSX Advanced Load Balancer uses servers to accommodate additional workload before load balancing a client to a server. NSX Advanced Load Balancer ensures that the servers perform correctly. Health monitors perform this function either by actively sending a synthetic transaction to a server or by passively monitoring client experience with the server. NSX Advanced Load Balancer sends active health monitors periodically that originate from Service Engines hosting the virtual service.
The following are the features of the health monitor:
The health monitors are attached to a pool for a virtual service.
A pool that is not attached to a virtual service will not send health monitors and is considered as an inactive configuration.
A pool can have multiple actively concurrent health monitors, such as ping, TCP, and HTTP, and a passive monitor.
All active health monitors must be successful for the server to be marked up.
For more information on SCTP Health Monitor, see Configuring SCTP Health Monitors.
Types of Health Monitors
The following are the two types of health monitors:
Active Health Monitor
Passive Health Monitor
Active Health Monitors
Active health monitors send customer queries to the servers. You can define send and receive timeout intervals, to determine the server response is successful or failed.
Active health monitors originate from the Service Engines hosting the virtual service. Each SE must be able to send monitors to the servers, which ensures there are no routing or intermediate networking issues that might prevent access to a server from all the active Service Engines. If one SE marks a server up and another SE marks a server down, each SE will include or exclude the server from load balancing according to their local monitor results.
The following are the configurable active health monitors:
DNS Monitor
External Monitor
GSLB Monitor
HTTP Monitor
HTTPS Monitor
Ping Monitor
RADIUS Monitor
TCP Monitor
UDP Monitor
SIP Monitor
Passive Health Monitor
While active health monitors provide a binary good/bad analysis of server health, passive health monitors provide a more subtle check by attempting to understand and react to the client-to-server interaction. Passive health monitors do not send a check to the servers, instead, NSX Advanced Load Balancer monitors end-user interaction with the servers. The server should quickly respond with valid responses, such as HTTP 200. If the server is sending back errors, such as TCP resets or HTTP 5xx errors, then the server is assumed to have errors. Errors are defined by the analytics profile attached to the virtual service. The analytics profile also defines the threshold for response time before a server is considered responding slowly.
With active health monitors, NSX Advanced Load Balancer will mark a server down after the specified number of consecutive failures and will no longer send new connections or requests until that the server can correctly pass the periodic active health monitors.
With passive health monitors, server failures will not cause NSX Advanced Load Balancer to mark that server as down. Rather, the passive health monitor will reduce the number of connections or requests sent to the server relative to the other servers in the pool by about 75%. Further failures may increase this percentage.
Best practice is to enable both a passive and an active health monitor to each pool.
Configuring Health Monitor Using NSX Advanced Load Balancer UI
The following are the steps to configure from NSX Advanced Load Balancer UI:
Navigate to .
Click the edit icon at the top right to edit health monitors.
Select the desired HTTP health monitor.
Check the Use Exact Request box.
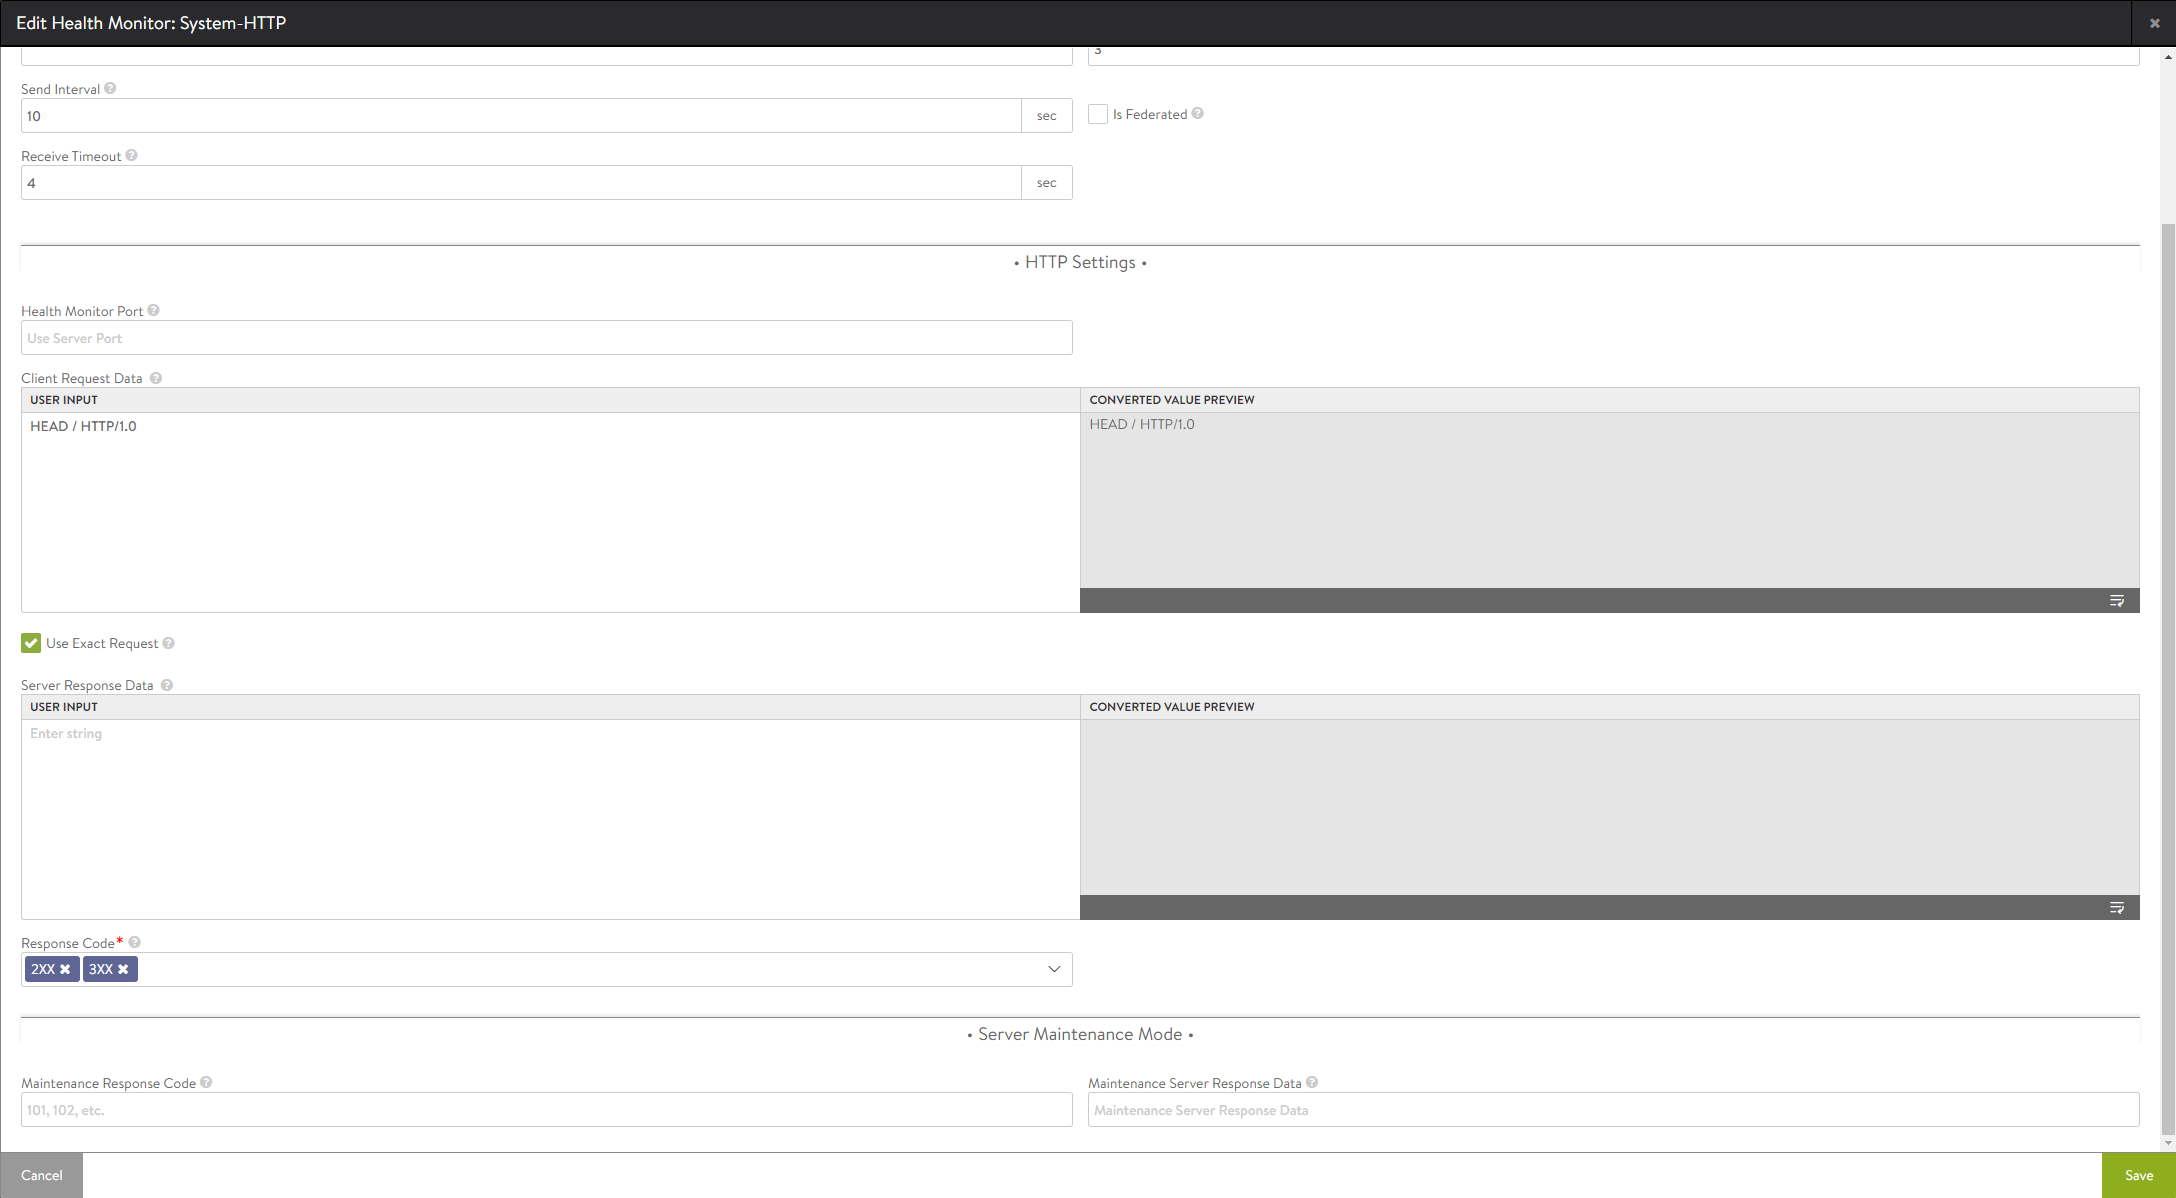
Click Save.
Configuring Health Monitor Using NSX Advanced Load Balancer CLI
Login to the NSX Advanced Load Balancer CLI and use configure healthmonitor System-HTTP command to change the value of the exact-http-request flag.
[admin:10-1-1-1]: > configure healthmonitor System-HTTP
[admin:10-1-1-1]: healthmonitor> http_monitor
[admin:10-1-1-1]: healthmonitor:http_monitor> http_request
[admin:10-1-1-1]: healthmonitor:http_monitor> http_request "HEAD / HTTP/1.0\r\n\r\n"
Overwriting the previously entered value for http_request
[admin:10-1-1-1]: healthmonitor:http_monitor> exact_http_request
Overwriting the previously entered value for exact_http_request
[admin:10-1-1-1]: healthmonitor:http_monitor>
[admin:10-1-1-1]: healthmonitor:http_monitor> save
[admin:10-1-1-1]: healthmonitor> save
Setting up Health Monitor
The following are the functionalities of health monitors:
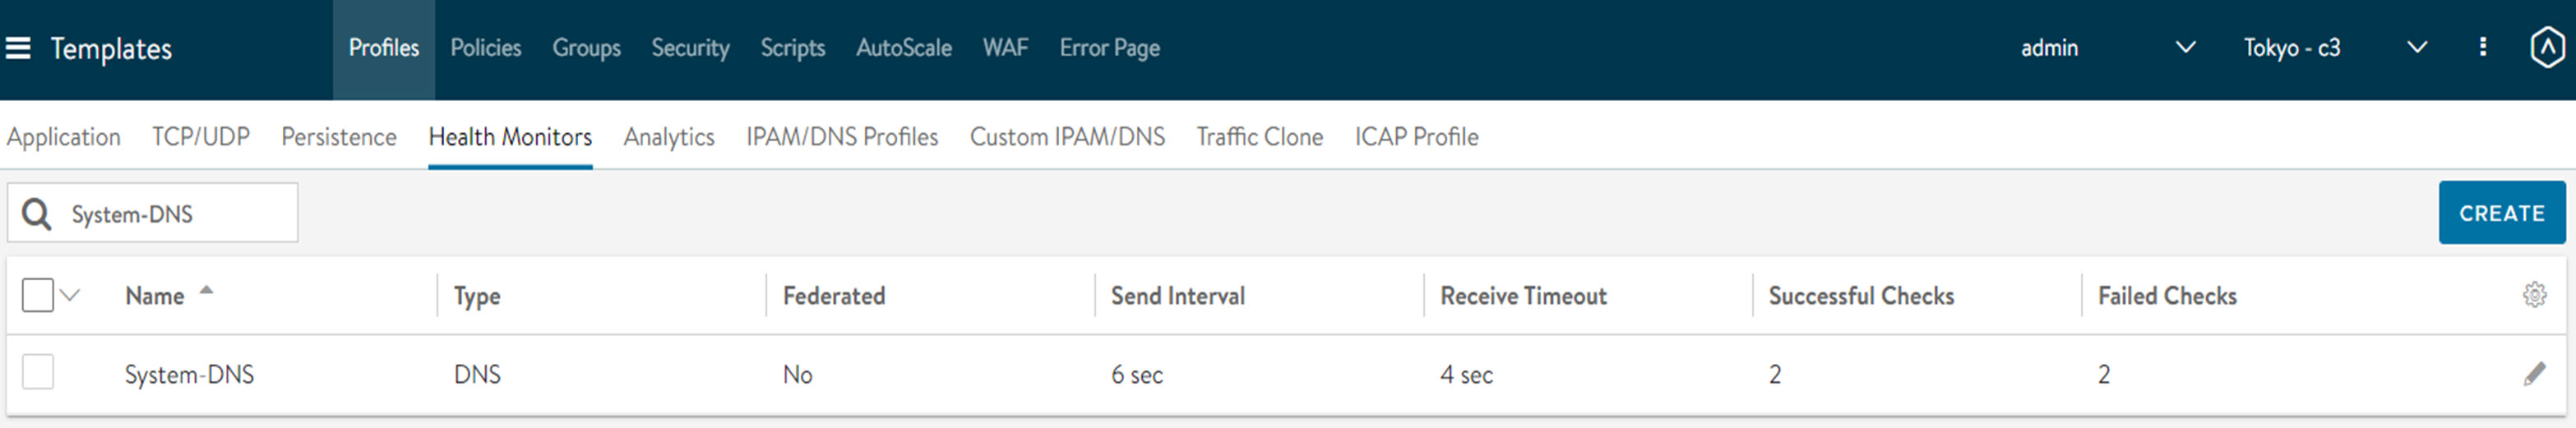
Navigate to .
Open Health Monitor tab.
The health monitor tab is displayed as follows:
This tab includes the following functions:
Search: Click the search icon to search across the list of objects.
Create: Click the edit icon to open the Edit Health Monitor window.
Edit: Click the edit icon to open the Edit Health Monitor window.
Delete: You can delete a profile if it is not currently assigned to a virtual service. An error message will indicate the VS referencing the profile. You can edit the default system profiles, but cannot delete the same.
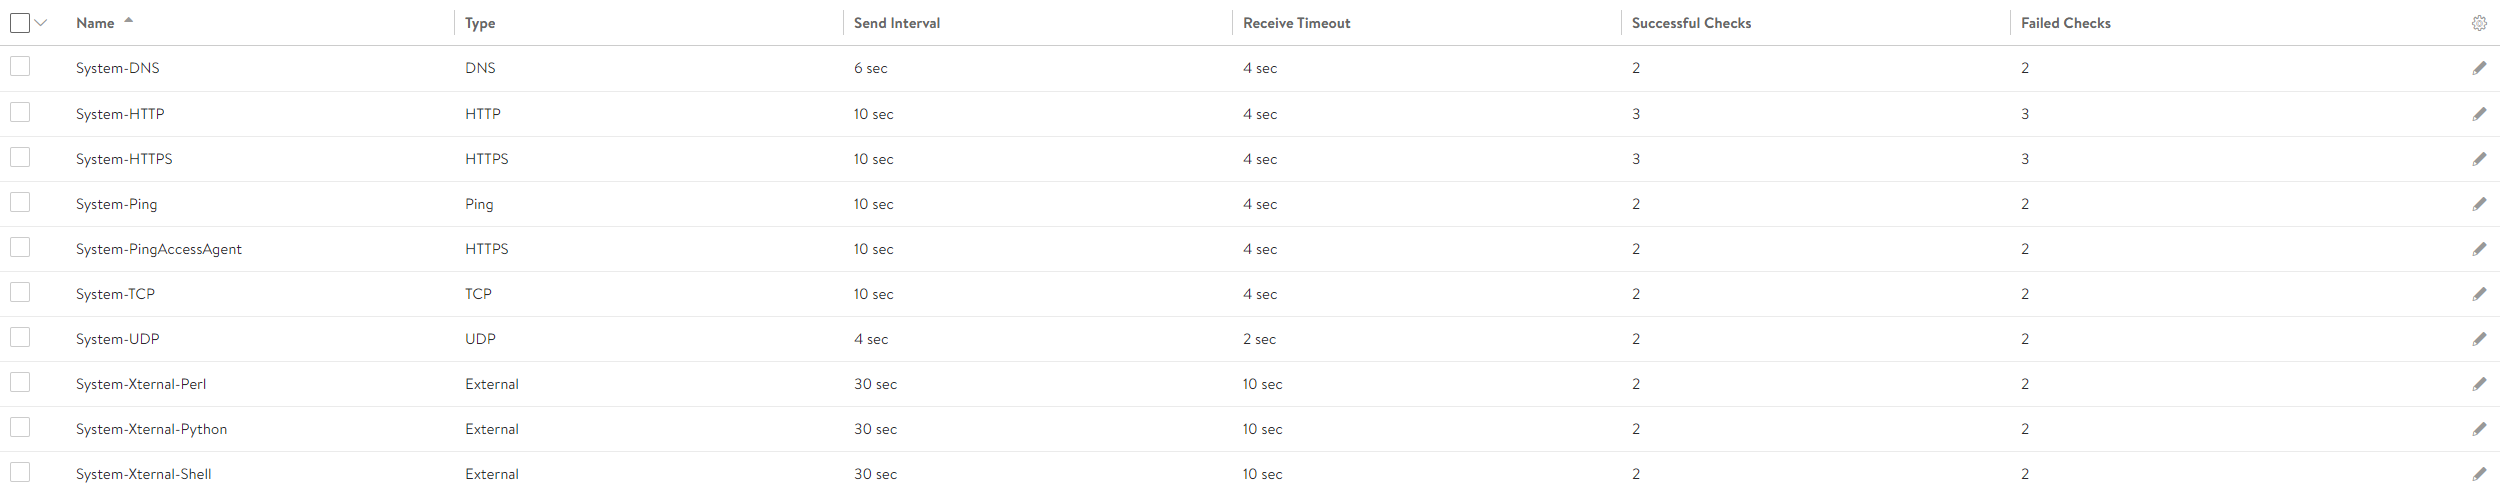
The table on this tab provides the following information for each health monitor profile:
Field |
Description |
|---|---|
Name |
The system displays the name of the health monitor. |
Type |
The system displays one of the following types of health monitor:
|
Send Interval |
The system displays the frequency at which the health monitor initiates a server check, in seconds. |
Receive Timeout |
The system displays the maximum amount of time before the server must return a valid response to the health monitor, in seconds. |
Successful Checks |
The system displays the number of consecutive health checks that must succeed before NSX Advanced Load Balancer marks a down server as being back up. |
Failed Checks |
The system displays the number of consecutive health checks that must fail before NSX Advanced Load Balancer marks an up server as being down. |
Creating New Health Monitor
The health monitors are attached to the pool for the virtual service. A pool that is not attached to a virtual service will not send health monitors. You can create a new health monitor by clicking Create button. The following window is displayed:
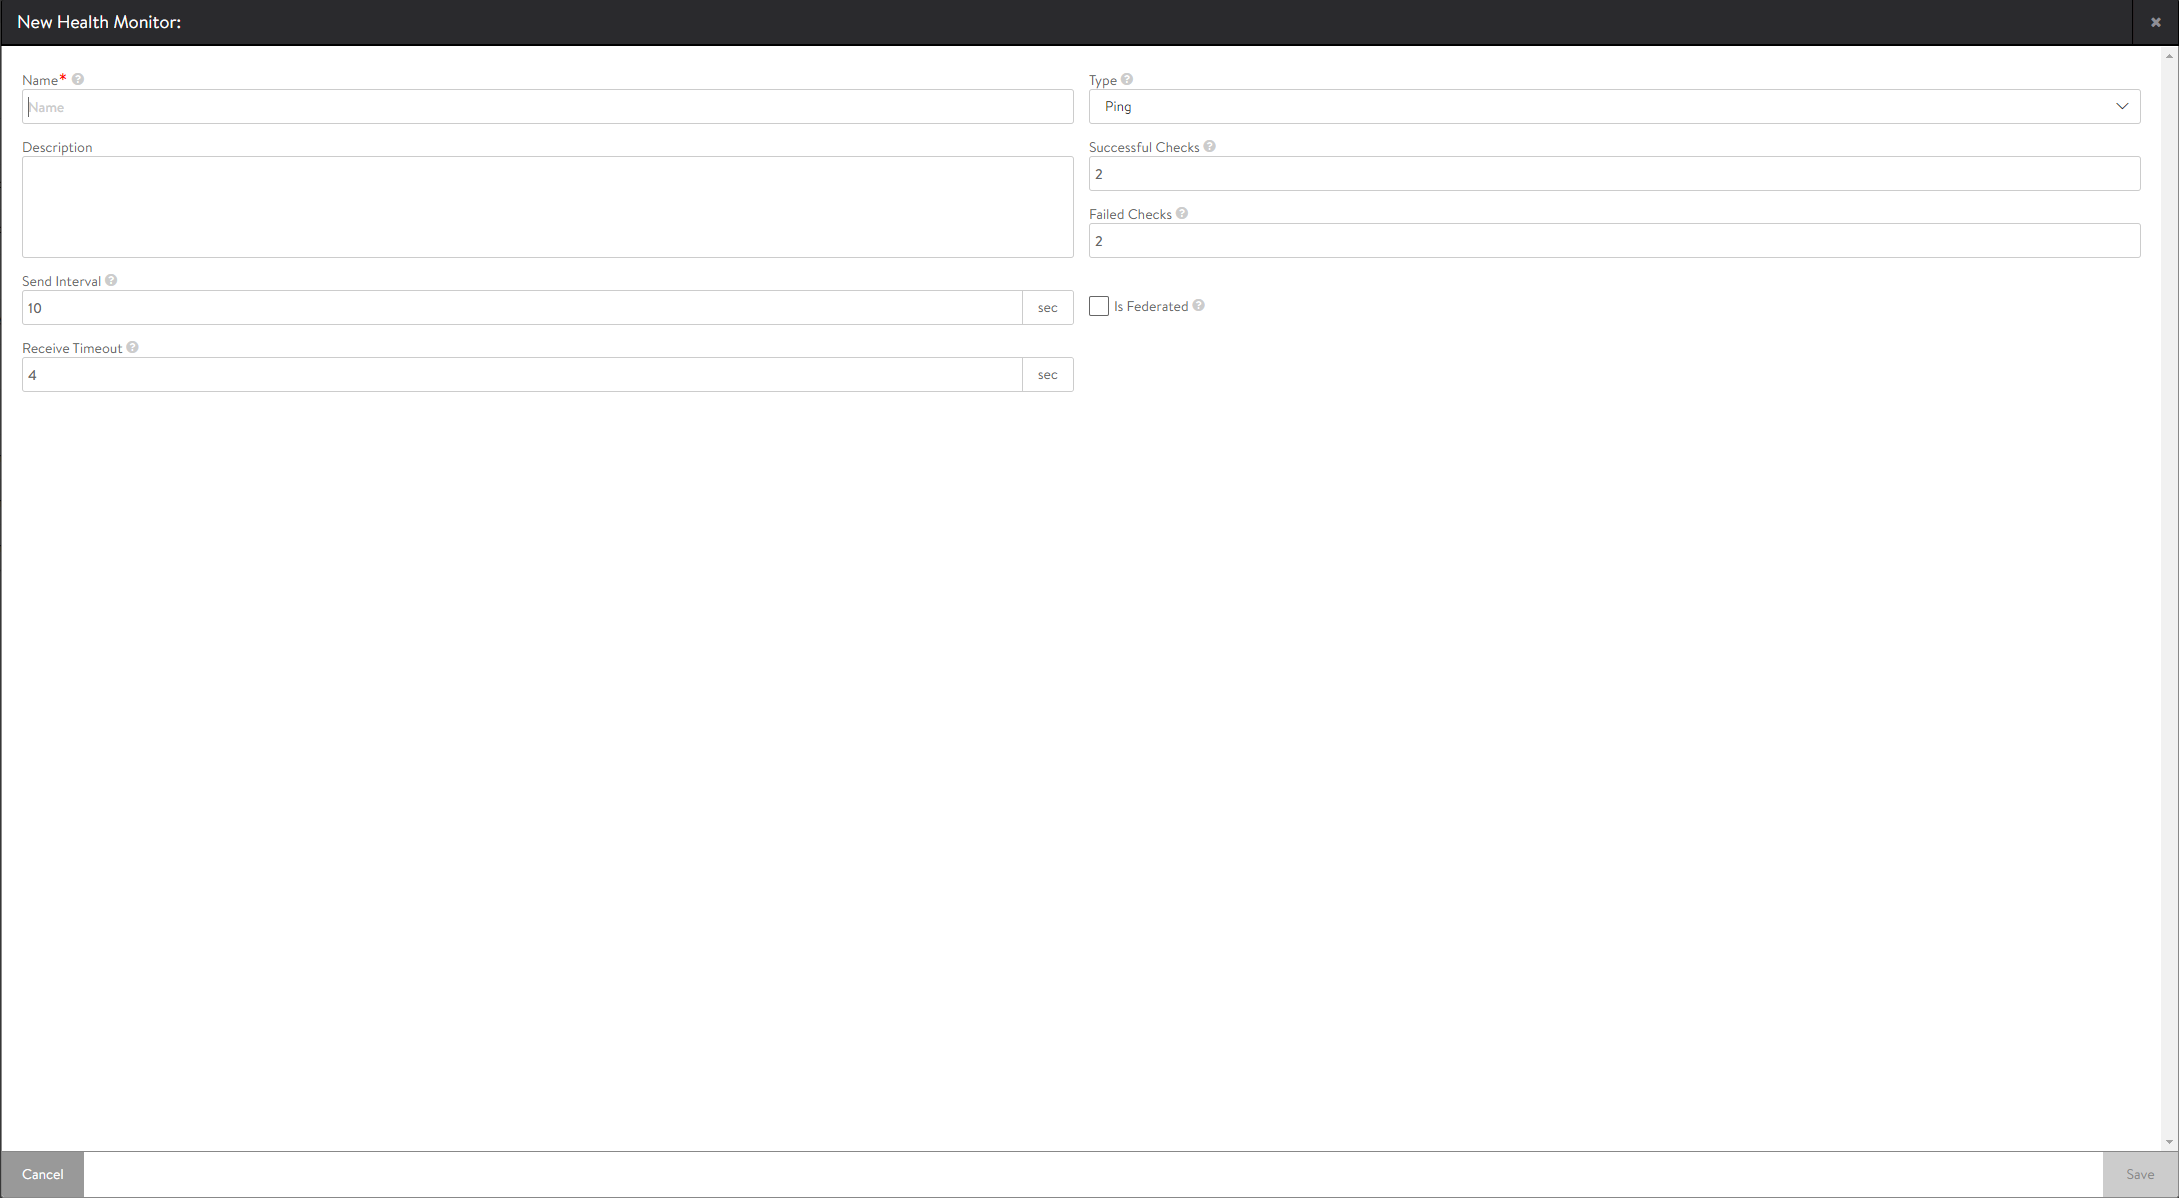
The New Health Monitor and Edit Health Monitor windows share the same interface.
To create or edit a health monitor specify the following details (applicable to active health monitors of every type):
Field |
Description |
|---|---|
Name |
Specify a unique name for the health monitor. This is a mandatory field. |
Description |
Specify free form text to be associated with the monitor. |
Send Interval |
Specify how frequently the health monitor initiates an active check of a server, in seconds. The minimum frequency is 1 second, and the maximum is 3600 seconds. |
Receive Timeout |
Specify the maximum amount of time before the server must return a valid response to the health monitor, in seconds. The minimum value is 1 second, and the maximum is the shorter of either 2400 seconds or the Send Interval value minus 1 second. If the status of a server continually flips between up and down, this may indicate that the value for Receive Timeout is too aggressive for the server. |
Type |
Select the type of health monitor from the drop-down list. The following are the options available in the drop-down list:
|
Successful Checks |
Specify the number of consecutive health checks that must succeed before NSX Advanced Load Balancer marks a down server as up. The minimum is 1, and the maximum is 50. |
Failed Checks |
Specify the number of consecutive health checks that must fail before NSX Advanced Load Balancer marks an up server as down. The minimum is 1, and the maximum is 50. |
Is Federated |
Check this box to replicate the health monitor across the federation of Controller clusters. If you uncheck this box, the health monitor will be visible within the Controller cluster and its associated SEs. |
In NSX Advanced Load Balancer, once the Type field is set and the monitor profile is created, you cannot amend this field.
